FIGURE 9.
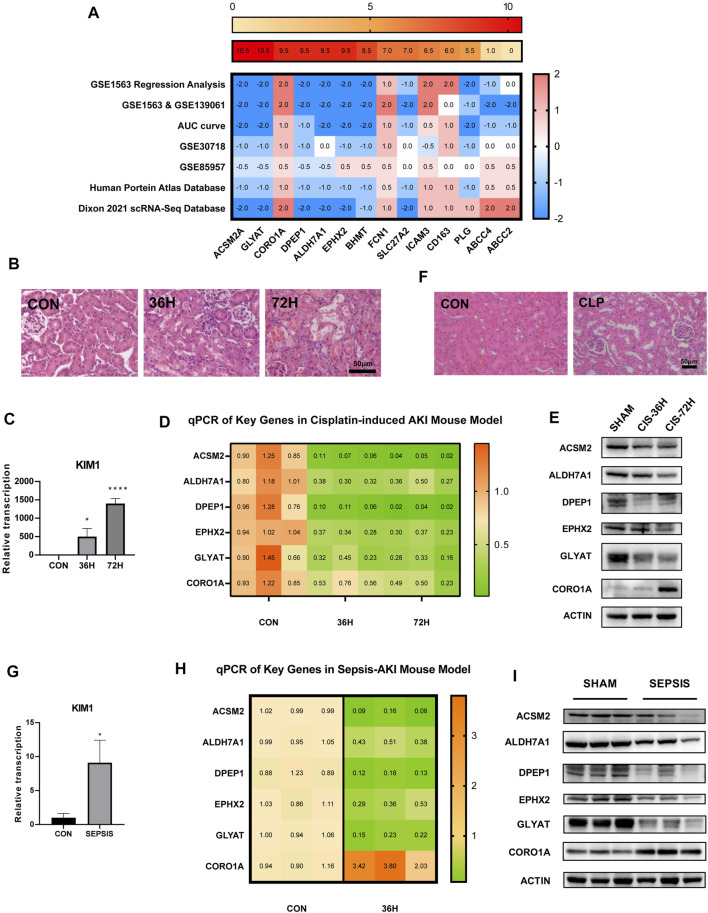
Validation of the mRNA and protein expression of RFRGs. (A) Score of the 14 RFRGs. The aforementioned heatmap shows the total scores of each gene, and the heatmap below shows the exact scores of seven analyses. (B,C) Degree of renal injury was measured by H&E staining and relative mRNA levels of KIM1 of kidney sections from the cisplatin-induced AKI model at different time points. (D,E) Relative mRNA level and representative immunoblot analysis of the top six RFRGs in the cisplatin-induced AKI model at different time points. (F,G) Degree of renal injury was measured by H&E staining and relative mRNA levels of KIM1 of kidney sections from the CLP-induced AKI model at different time points. (H,I) Relative mRNA level and representative immunoblot analysis of the top six RFRGs in the CLP-induced AKI model at different time points. *p < 0.05, **p < 0.01, ***p < 0.001, and ****p < 0.0001 vs. control group.

