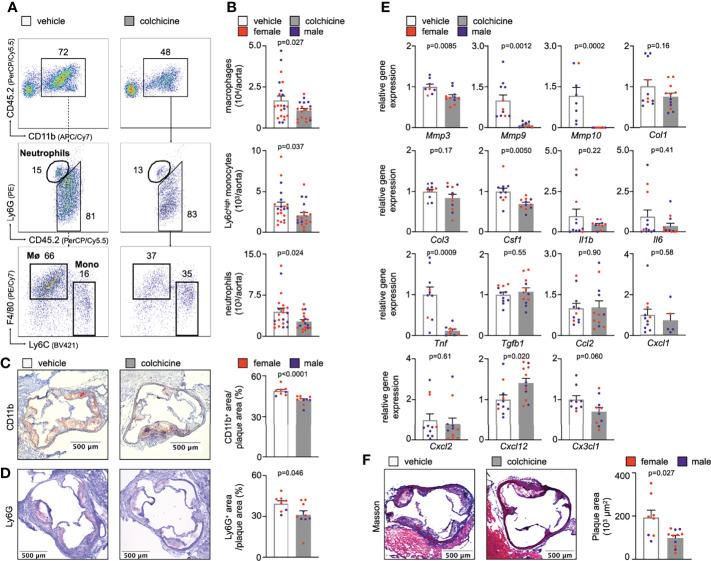
Figure 1.
Colchicine treatment reduces plaque inflammation. (A) Flow cytometric gating and (B) quantification of myeloid cells in atherosclerotic aortas in vehicle- vs. colchicine-treated Apoe-/- mice (n=18-21 per group, 62-67% female, Welch’s t-test for macrophages (Mø), Mann-Whitney U-test for monocytes (Mono) and neutrophils as appropriate). Numbers next to gates indicate population frequencies (%). Representative immunohistochemical staining for (C) myeloid cells (CD11b) and (D) neutrophils (Ly6G) of sectioned aortic roots from vehicle- vs. colchicine-treated Apoe-/- mice (n=8-10 per group, 60-75% female, Mann-Whitney U-test for CD11b, Student’s t-test for Ly6G). Bar graphs show quantification of positive CD11b- and Ly6G-area, respectively. Scale bars represent 500 µm. (E) Quantitative real-time PCR for gene expression quantification of fibrotic, inflammatory and cytokine genes in aortas of vehicle- vs. colchicine-treated Apoe-/- mice (n=5-12 per group, 55-88% female, Student’s/Welch’s t-test or Mann-Whitney U-test as appropriate). Mmp3/Mmp9/Mmp10 (matrix metalloproteinase-3/9/10), Col1/Col3 (collagen-1/3), Csf1 (colony stimulating factor 1), Il1β (interleukin 1 beta), Il6 (interleukin 6), Tnf (tumor necrosis factor), Tgfb1 (transforming growth factor beta 1), Ccl2 (C-C Motif Chemokine Ligand 2), Cxcl1 (C-X-C Motif Chemokine Ligand 1), Cxcl2 (C-X-C Motif Chemokine Ligand 2), Cxcl12 (C-X-C Motif Chemokine Ligand 12), Cx3cl1 (C-X3-C Motif Chemokine Ligand 1). Data are presented as mean+s.e.m. (F) Representative Masson Trichrome staining and quantification of total plaque area (n=8-11 per group, 64-75% female, Welch’s t-test). Scale bars represent 500 µm. Dots within bar plots show the gender of the mice with a color code: purple (male) and red (female).

