FIGURE 1.
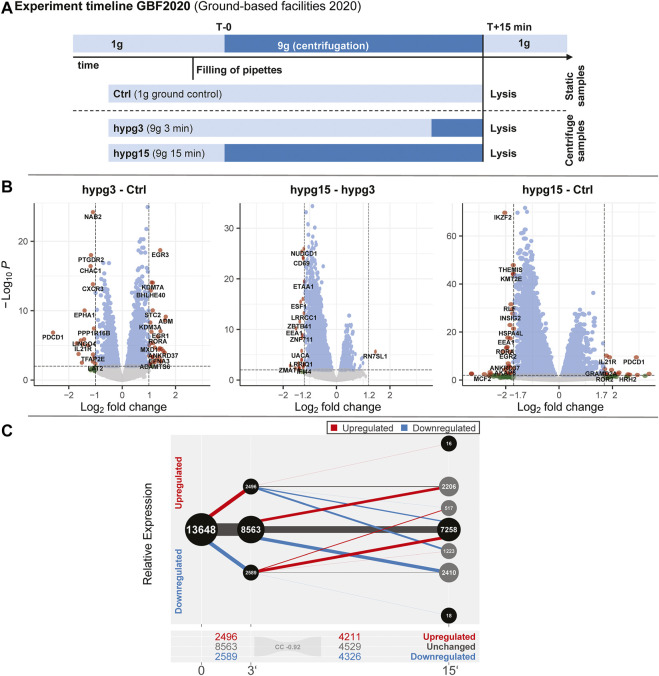
Global dynamics of the effects of hypergravity on the transcript pool. (A) Experiment fixation scheme. Overview of the experimental conditions for which samples were acquired. During the ground-based facilities 2020 campaign, Jurkat T cells were filled into 1 ml pipettes, incubated for 15 min and then rapidly emptied into RLT lysis buffer. During these 15 min, four samples remained at 1xg gravity (Ctrl), and four samples stayed at 1xg for 12 min and where consequently exposed to 9xg on a pipette centrifuge for 3 min before lysis (hypg3). A third group was exposed to 9xg for the entire 15 min before lysis (hypg15). (B) Volcano plots of all three temporal comparisons show the overall distribution. Genes with highest fold change that exceed the p value thresholds of ±1.0/±1.2/±1.7 are annotated. Hypg15-hypg3 and hypg15-Ctrl show a pronounced skew towards downregulation, for hypg3 a slight tendency towards upregulation is apparent. An MA plot analysis can be found in Supplementary Figure S3. (C) Temporal coherence of gene expression. The number of genes that were upregulated/downregulated after 3 min is shown (three balls at 3′). Starting from these pools, genes that were consistently or even exceedingly up-/downregulated (lines to upper two balls, lower two balls), those that were no longer differentially regulated (lines to center ball) or only slightly elevated/lower (lines to inner two grey balls), or even regulated in the opposite direction (lines crossing the middle) are displayed. The line width represents the number of genes in each category. Most genes that were differentially expressed after 3 min were either no longer differentially expressed (dominantly for downregulated) or even regulated in the opposite direction (dominantly for downregulated) after 15 min. Continuous regulation in a single direction was very rare. The Spearman correlation coefficient between fold changes of the hypg3-Ctrl and the hypg15-hypg3 comparison is displayed at the bottom.

