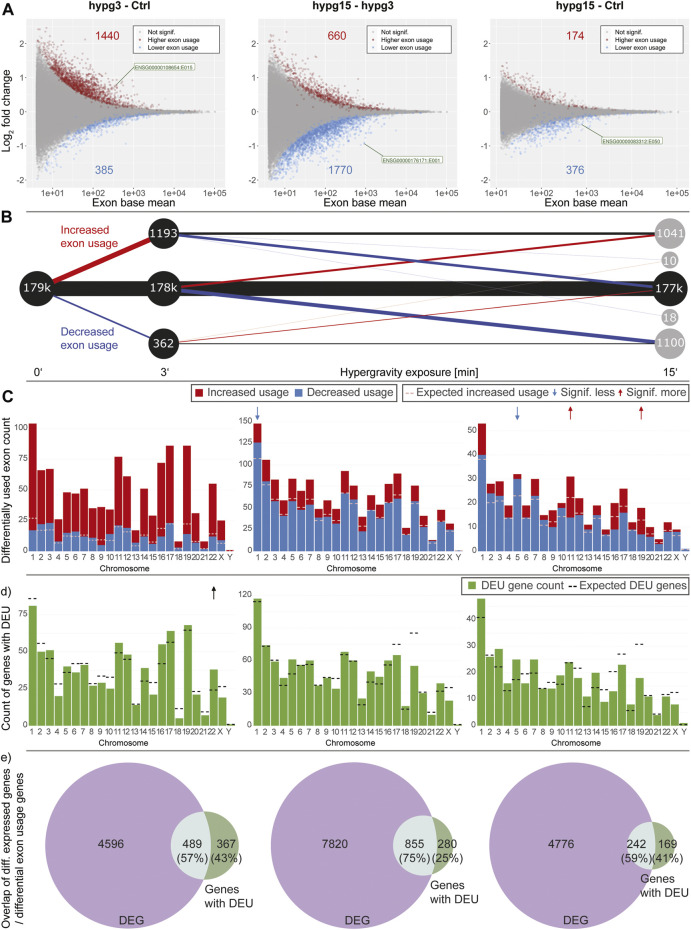
FIGURE 4.
Splicing dynamics. (A) MA plot for fold changes of exons for all three comparisons in time. Exons that showed significantly increased or decreased usage are highlighted. The exon with the lowest p value is highlighted for each comparison. A skew towards upregulation and overall diminishing effect strength over time become visible. (B) Temporal coherence of differentially used exons. For exons that were called differentially used, the behavior between 3 and 15 min resp. after 15 min is shown. Only exons that have a non-NA false discovery rate (FDR) value for all three contrasts are shown, leading to smaller numbers of differentially used exons after 3 min. The same filter logic as for Figures 1C, 2A,B was used. The line width for non-significant exons has been scaled to 1/10th to assure visibility. (C) Distribution of exons with significant differential usage over all chromosomes for all three comparisons. The expected number of exons with increased usage per chromosome is indicated with a dashed line. If the deviation between the expectation and the actual number is significant, it is indicated with an arrow on top of the diagram, comparable to Figure 4. Exon usage tightly followed the expectation for most chromosomes, only for the later comparisons do deviations become evident. (D) Distribution of genes that showed significant differential exon usage over all chromosomes. Expected number of genes per chromosomes is indicated with a dashed line. (E) Overlap between genes that showed differential gene expression and genes that showed differential exon usage for the given comparison. A large fraction of genes simultaneously showed differential gene expression and differential exon usage, yet there is a sizeable fraction (25–43%) of genes that singularly displayed differential exon usage.

