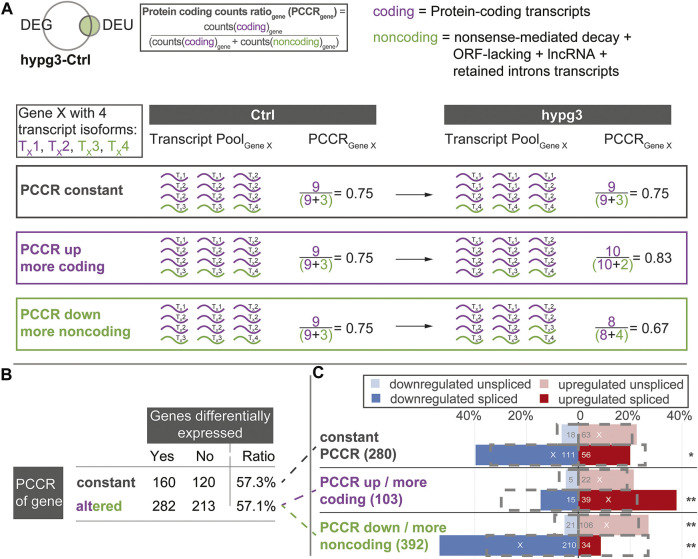
FIGURE 6.
Protein coding counts ratio analysis of genes with differential exon usage. Quantitative analysis of the results from Figure 5C. Assessment if the transcript pool composition of genes changed between mostly coding transcripts and non-coding transcripts, and if this is associated with differential expression of these genes. (A) Definition of protein coding counts ratio (PCCR) as the fraction of RNA sequencing counts of coding transcripts over all counts of a given gene. Examples for a constant, increased, and decreased PCCR between Ctrl and hypg3 are given. (B) The fraction of differentially expressed genes was analyzed for genes where the PCCR was altered (up and down) and for those with unaltered PCCR. (C) Split between genes with constant PCCR, increased PCCR, and decreased PCCR. For each subset of genes, the number of genes that is significantly upregulated or downregulated in the spliced and unspliced fraction is indicated. The grey boxes indicate the expected distribution from the overall DEG datasets. Significant deviations from the expectation based on a Fisher exact test are indicated (** for p < 0.01, * for p < 0.05). An “X” indicates the mean direction of differential gene expression. An extended analysis can be found in Supplementary Figure S11.

