FIGURE 7.
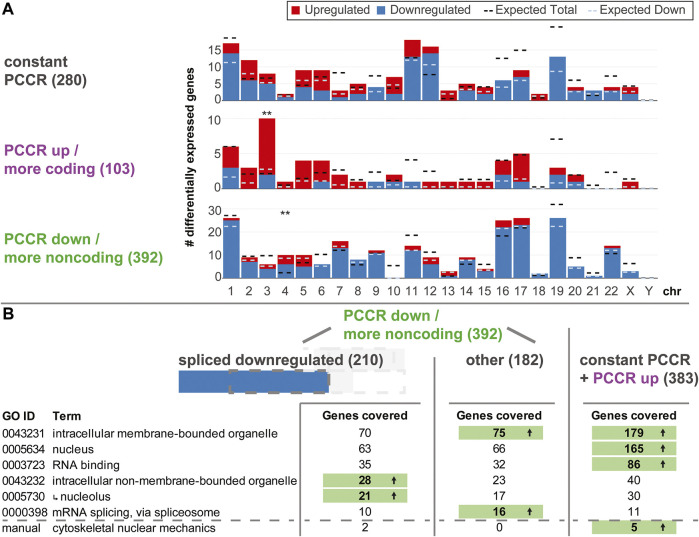
Functional analysis of genes with constant, increased, and decreased PCCR. (A) Number of differentially upregulated (red) and downregulated (blue) genes per chromosome (horizontal axis) for genes with constant PCCR, increased PCCR, and decreased PCCR. The expected number of total DEGs per chromosome (based on the fraction of differentially expressed genes for all genes and the number of detected genes per chromosome and assuming a uniform probability of differential expression) is shown as a black dashed line, the expected number of downregulated genes out of the set of up- and downregulated genes is shown as a dashed light blue line. Chromosomes with significantly more or less differentially expressed genes are indicated with black stars, those with a significant deviation in the distribution of up-versus downregulated genes with blue stars (FDR <0.05 *, FDR <0.01 **). (B) Gene Ontology (GO) enrichment analysis of genes with decreased PCCR that are downregulated in the spliced dataset (left), all remaining genes with decreased PCCR (middle), and those with constant or increased PCCR (right). Only gene Ontology sets covering a large fraction of genes from the groups are listed. Further, a manually curated gene set was analyzed, containing factors involved in the cytoskeletal nuclear mechanical axis. If the number of covered genes significantly (FDR <0.05) exceeds the statistical expectation, it is highlighted in green with an arrow. The nucleolus GO set is a subset of the intracellular non-membrane-bounded organelle set, as indicated by an arrow.

