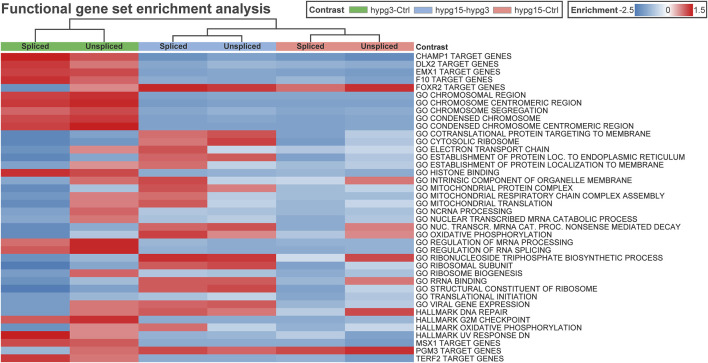
FIGURE 8.
Correlating regulatory effects with differential gene expression. Functional gene set enrichment analysis for differential gene expression for all three comparisons. The analysis was conducted separately for unspliced and for spliced transcripts. Selected MSigDB sets were analyzed, including GO pathways, transcription factor targets, hallmark genes, etc. Most gene sets show a rebound effect with either upregulation after 3 min and consecutive downregulation between 3 and 15 min or the other way around. Only a few sets show consistent enrichment for both spliced and unspliced data, including GO translational initiation which is consistently downregulated.

