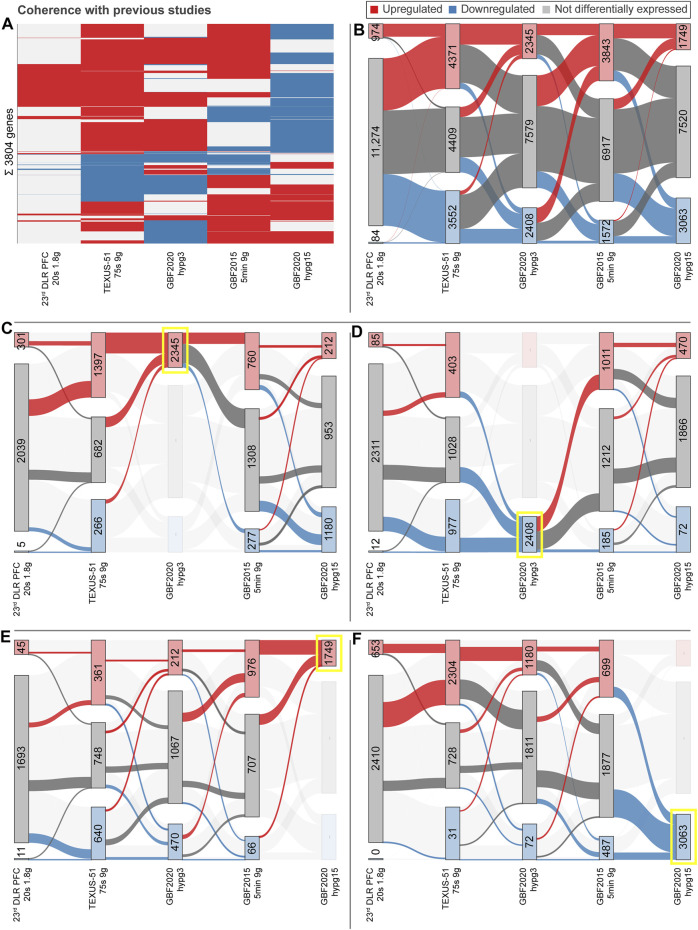
FIGURE 9.
Coherence of transcriptional dynamics with other hypergravity studies at different timepoints. Hypergravity comparisons from previous studies have been added to the two comparisons hypg3- Ctrl and hypg15-Ctrl, including 20 s of 1.8xg hypergravity from the 23rd DLR Parabolic Flight Campaign (PFC), 75 s of on average 9xg hypergravity during the TEXUS-51 campaign, and 5 min of 9xg hypergravity from the 2015 ground-based facilities campaign (GBF 2015). Data sets are filtered for genes that could be detected in all data sets. Data sets are ordered by exposure time. (A) Clustered heat map of all genes that are differentially expressed in at least 3/5 of the data sets, a total of 3805 genes. Significantly (FDR <0.05) upregulated genes are indicated in red, downregulated in blue, not significantly differentially expressed in grey. (B–F) Sankey flowchart of gene expression behavior over time. For each data set, corresponding to a point in time, the number of significantly (FDR <0.05) upregulated (red), not differentially expressed (grey), and downregulated (blue) genes is given. Box heights are proportional to the number of genes. For each category at each timepoint, the number of genes that consecutively become upregulated, downregulated, or not differentially expressed at the next timepoint is indicated by colored connectors of different sizes. This is either performed for all genes (B) or highlighting the behavior of genes that are upregulated or downregulated at a certain point in time, including upregulated after 3 min (C), downregulated after 3 min (D), upregulated after 15 min (E), and downregulated after 15 min (F).

