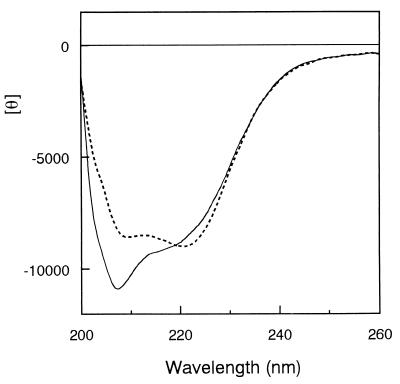
FIG. 3.
CD spectra. The far-UV CD spectrum of T. kodakaraensis subtilisin (solid line) is shown in comparison with that of subtilisin E (broken line). These spectra were measured at 20°C. The mean residue ellipticity θ, which is measured in degrees square centimeter per decimole, was calculated using an average amino acid molecular weight of 110.

