Figure 1.
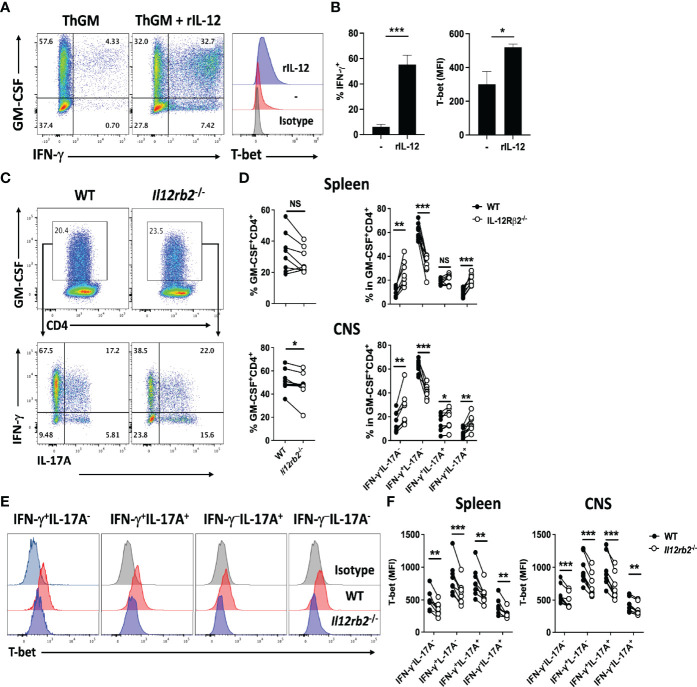
IL-12 induces T-bet expression in ThGM cells. WT naïve CD4+ T cells were differentiated into ThGM cells in vitro and treated with IL-12 in the second stimulation. (A) Representative flow cytometry dot plots showing GM-CSF, IFN-γ, and T-bet expression by ThGM cells after IL-12 treatment. (B) Proportions (%) of Th1-like cells after IL-12 treatment (left graph). Mean fluorescent intensity (MFI) of T-bet expression after IL-12 treatment (right graph). (C) WT (CD45.1) and Il12rb2 -/- (CD45.2) CD4+ T cells were transferred into Rag1 -/- mice (n = 8). Recipient mice were immunized for EAE induction, and cells obtained from the spleen and CNS were analyzed at the peak of disease. Representative flow cytometry dot plots showing GM-CSF, IFN-γ, and IL-17A expression by WT and Il12rb2 -/- CD4+ T cells in the spleen of mice with EAE. (D) Proportions (%) of GM-CSF+ cells among WT and Il12rb2 -/- CD4+ T cells analyzed in the spleen and CNS mice with EAE. Proportions (%) of different Th lineages in WT and Il12rb2 -/- GM-CSF+CD4+ T cells analyzed in (D). (E) Representative histograms showing T-bet expression by different Th lineages in WT and Il12rb2 -/- GM-CSF+CD4+ in the CNS. (F) MFI for T-bet expression by different Th lineages in WT and Il12rb2 -/- GM-CSF+CD4+ in the spleen and CNS. Data shown are mean ± SEM. P-values were calculated using unpaired Student’s t-test (A, B) and paired Student’s t-test with Bonferroni’s multiple comparison (C–F); *p < 0.05, **p < 0.01, ***p < 0.001, NS, not significant.

