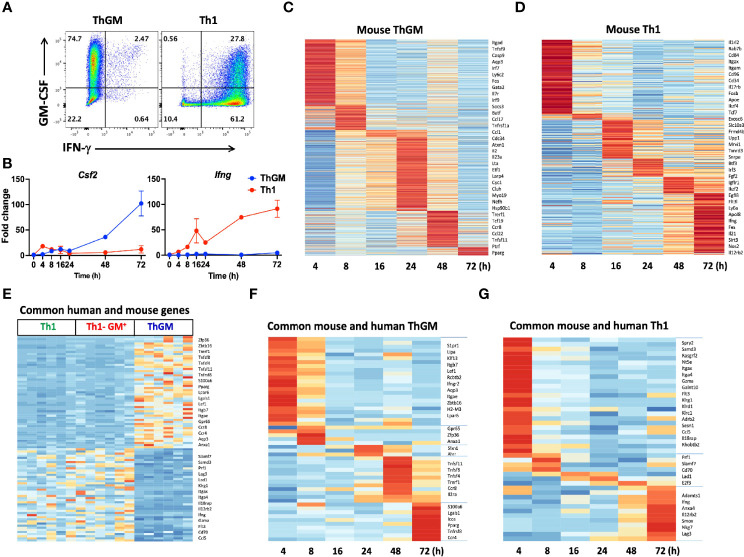
Figure 6.
Mouse and human ThGM cells have similar transcriptomes. Mouse 2D2 naïve CD4+ T cells were differentiated into ThGM and Th1 cells, their RNA was extracted at different time points and analyzed by RNA-seq. (A) Representaive flow cytometry plots showing GM-CSF and IFN-γ expression by mouse ThGM and Th1 cells. (B) FPKM at different time points were normalized relative to FPKM of naive CD4+ T cells (0 h). Graphs showing fold change expression of GM-CSF and IFN-γ by Th1 and ThGM cells. Heatmaps for ThGM (C) and Th1 (D) -specific genes at different time points. (E) Differentially expressed genes by mouse and human ThGM and Th1 cells were compared. Heatmap showing expression of commonly expressed genes between in vitro-polarized mouse Th1 and ThGM, and natural human ThGM, GM-CSF+Th1, and Th1 cells. (F) Heatmap showing expression of commonly expressed genes between in vitro-polarized mouse and natural human ThGM and (G) Th1 cells. Data shown are mean ± SEM.

