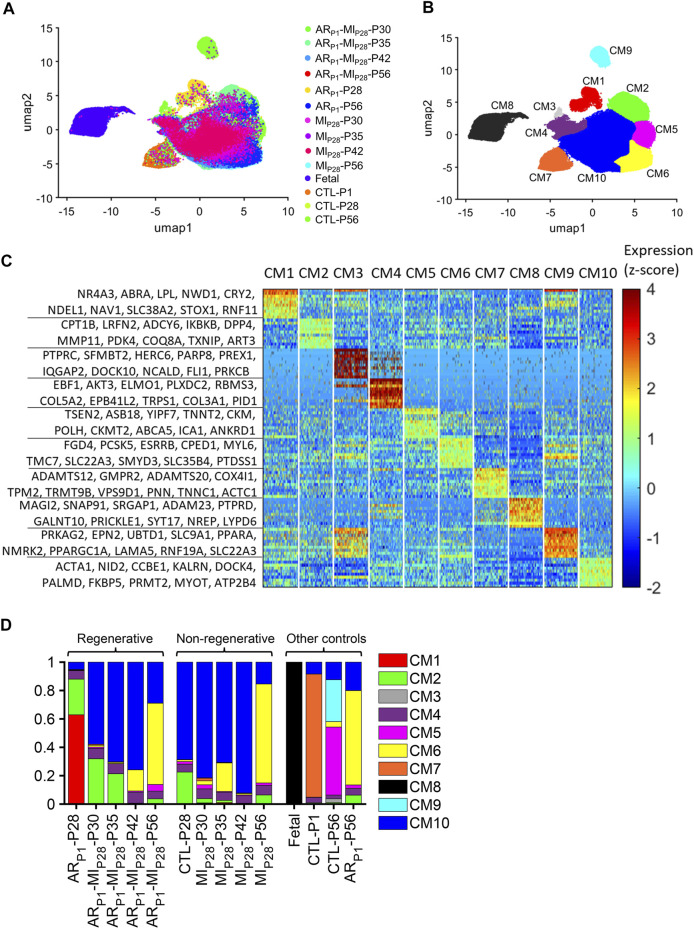
FIGURE 1.
Cluster analysis identified 10 populations of cardiomyocytes in Fetal, CTL, ARP1, MIP28, and ARP1MIP28 hearts. (A,B) Cardiomyocyte snRNA-seq data were reduced to 10 dimensions with an autoencoder, processed via cluster analysis, visualized via UMAP, and displayed according to (A) experimental group and time point and (B) cluster (CM1–CM10). (C) The expression of genes that were explicitly associated with each cluster is displayed as a heat map. (D) The proportion of cardiomyocytes from each cluster is displayed for each experimental group and time point.

