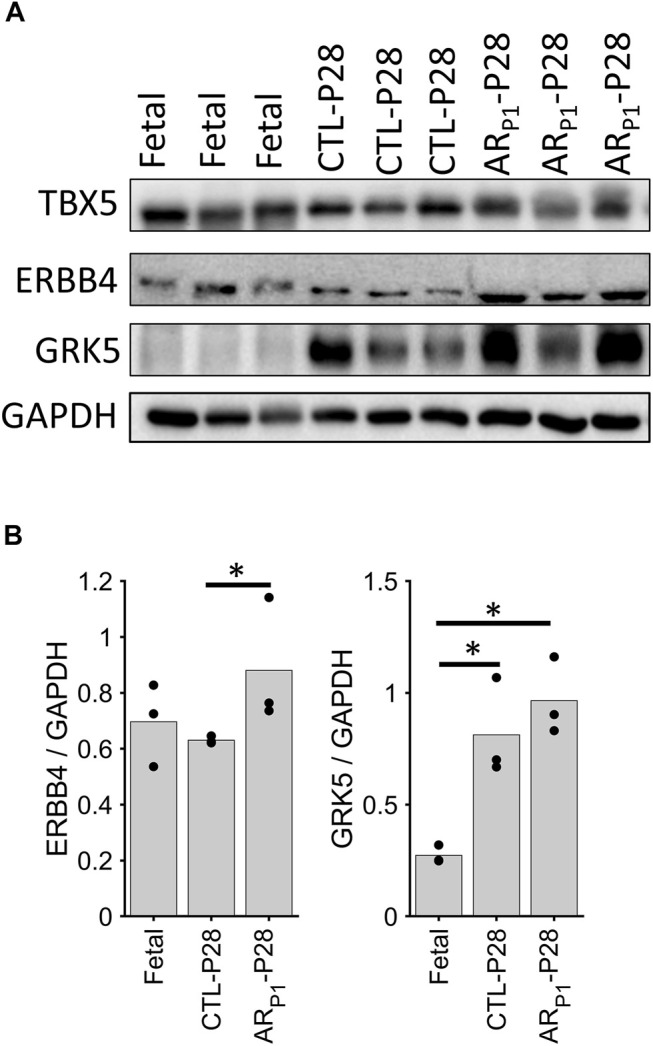
FIGURE 6.

Western blotting confirming ERBB4 and GRK5 expression. The expression in each sample was scaled according to GAAPDH level to ensure equal loading. (A) Representative Western Blotting image in each group. Each row presents a protein, in order: ERBB4, and GRK5. Each column presents a sample, in order: Fetal (3 samples), CTL-P28 (3 samples), and ARP1-P28 (3 samples). (B) Bar chart comparing the average expression among groups. Here, the value for each sample is represented in a circle dot. The horizontal lines and stars (*) represent nonparametric statistical comparisons between two groups. *p-value < 0.05.
