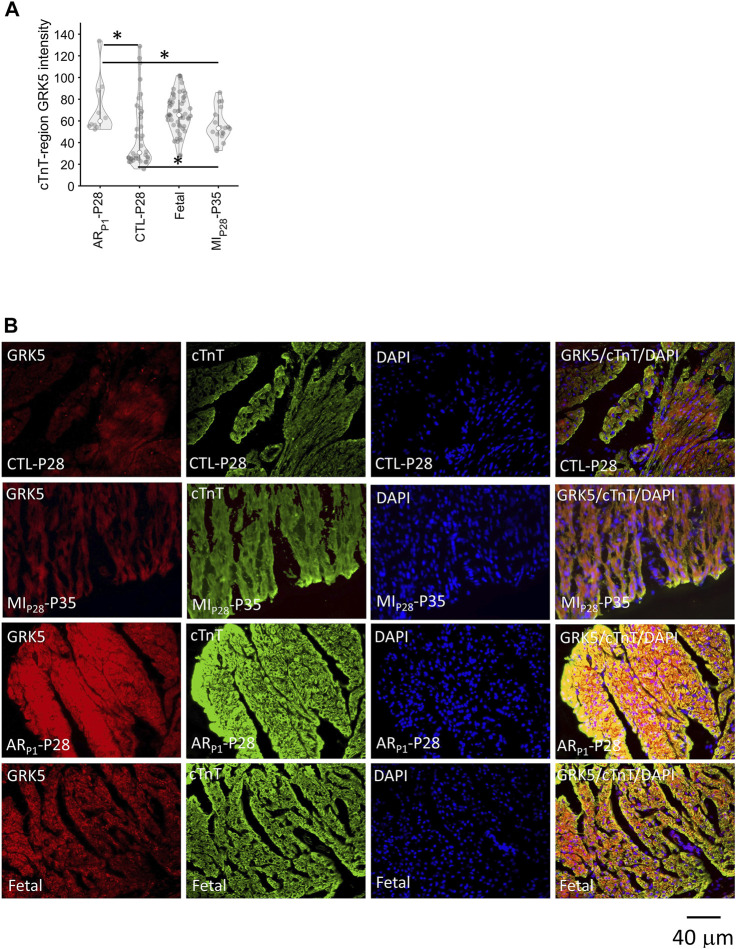
FIGURE 7.
Immunofluorescence analysis confirming GRK5 expression in cardiomyocytes. Here, the expression of GRK5 was represented by the average GRK5 red-channel value (light intensity) that is overlapped with cardiac troponin (cTnT) blue-channel (foreground), which was calculated after adjusting GRK5 red-channel background. DAPI (blue) indicates nuclei. (A) Violinplot of GRK5 intensity in 118 staining images. Here, the horizontal bar and the star (*) indicate nonparametric Wilcoxon’s rank sum test between two sample groups. *p-value < 0.05. (B) Representative images of GRK5/cTnT/DAPI in each group.

