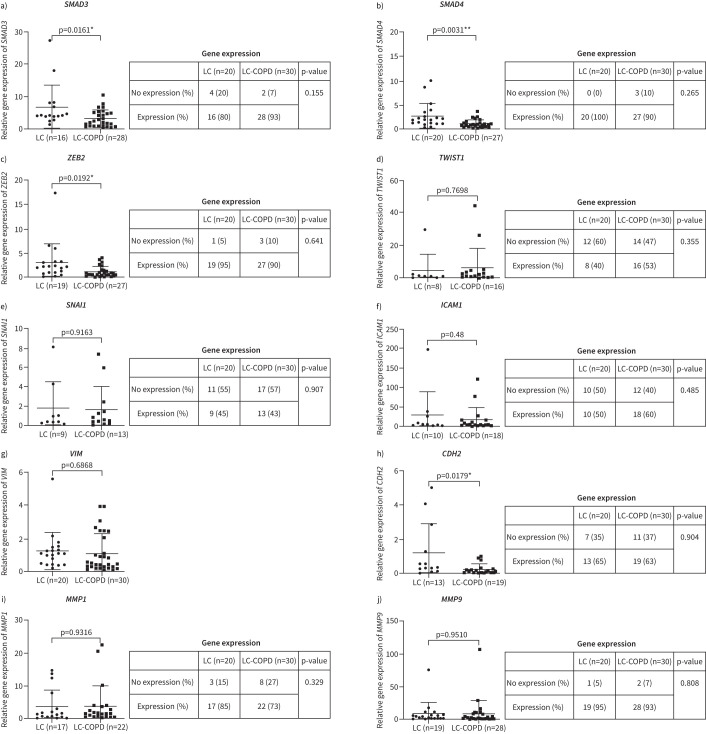
FIGURE 3.
Quantitative real-time PCR amplification analysis of gene expression of epithelial–mesenchymal transition (EMT) between lung cancer (LC) and LC-COPD patients (graphs), and comparisons of the number of patients expressing the target genes of EMT (tables). a) SMAD3 (mothers against decapentaplegic homolog 3); b) SMAD4; c) ZEB2 (zinc finger E-box binding homeobox 2); d) TWIST1; e) SNAI1; f) ICAM1 (intercellular adhesion molecule 1); g) VIM (vimentin); h) CDH2 (cadherin 2); i) MMP1 (matrix metalloproteinase 1); j) MMP9. Graph data are presented as mean±sd. Two-tailed t-tests were used to assess significance of differences: *: p<0.05; **: p<0.01.

