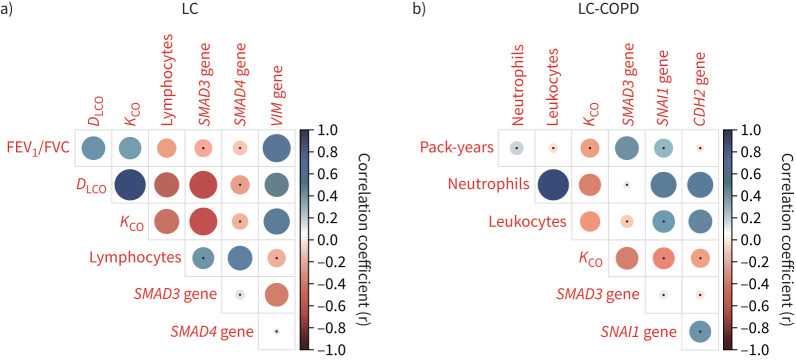
FIGURE 4.
Clinical correlations in each group of patients. a) Correlation matrix of the clinical and analytical variables in lung cancer (LC) patients. b) Correlation matrix of the clinical and analytical variables in LC-COPD patients. In the matrices, positive correlations are represented as blue dots, while negative correlations are represented as red dots. Black dots within the circles represent p-values >0.05. Colour intensity and the size of the circle are proportional to the correlation coefficients, as indicated on the y-axis on the right-hand side of the graphs. FEV1: forced expiratory volume in 1 s; FVC: forced vital capacity; DLCO: diffusing capacity of the lung for carbon monoxide; KCO: Krogh transfer factor; SMAD: mothers against decapentaplegic homolog; VIM: vimentin; CDH: cadherin.

