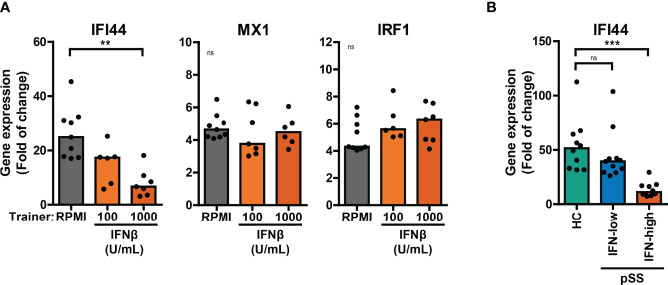
Figure 5.
Differential ISG response to type I IFN in IFNβ-trained THP-1 and patient’s PBMCs. (A) Relative mRNA expression (2ΔΔCT) of IFI44, MX1 and IRF1 in IFNβ-trained THP-1 cells re-stimulated with 100 IU/mL IFNβ for 4 hours. (B) Relative mRNA expression (2ΔΔCT) of IFI44 in PBMCs from pSS stratified based on blood ISG expression and HC stimulated with 100 IU/mL IFNβ for 2 hours. Fold change expression was calculated relative to unstimulated cells. Depending on the data distribution, bars represent means or medians and One-way ANOVA or Kruskal-Wallis test were used to compare groups. ns: not significant, **p<0.01, ***p<0.001.

