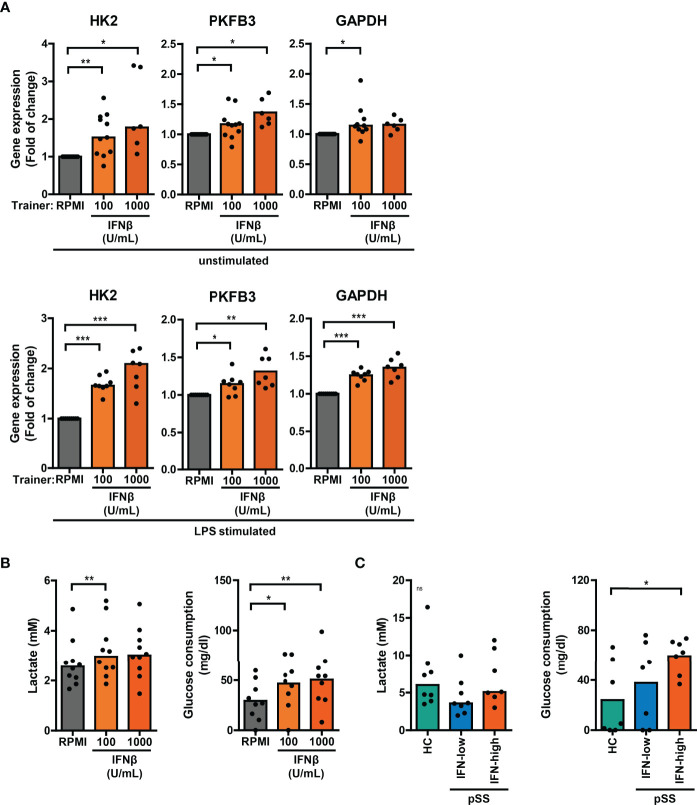
Figure 6.
Altered glucose metabolism in type I IFN-trained THP-1 and patient’s PBMCs. (A) Relative mRNA expression (2ΔΔCT) of HK2, PKFB3 and GAPDH in THP-1 cells trained with IFNβ either before re-stimulation (upper panel) or after 24 hour stimulation with 50 ng/mL LPS (lower panel). Fold change expression was calculated relative to the corresponding untrained (RPMI) cells. (B, C) Lactate concentrations (left) in culture supernatants and glucose consumption (right) by 24 hour LPS-stimulated (B) THP-1 cells trained with IFNβ or (C) PBMCs from pSS and HC. One sample t-test or Wilxocon singed rank test were used to compare means/medians with a hypothetical 1 and repeated measures ANOVA or Friedman test, or Kruskal-Wallis test was used to compare groups. ns: not significant, *p<0.05, **p<0.01, ***p<0.001.

