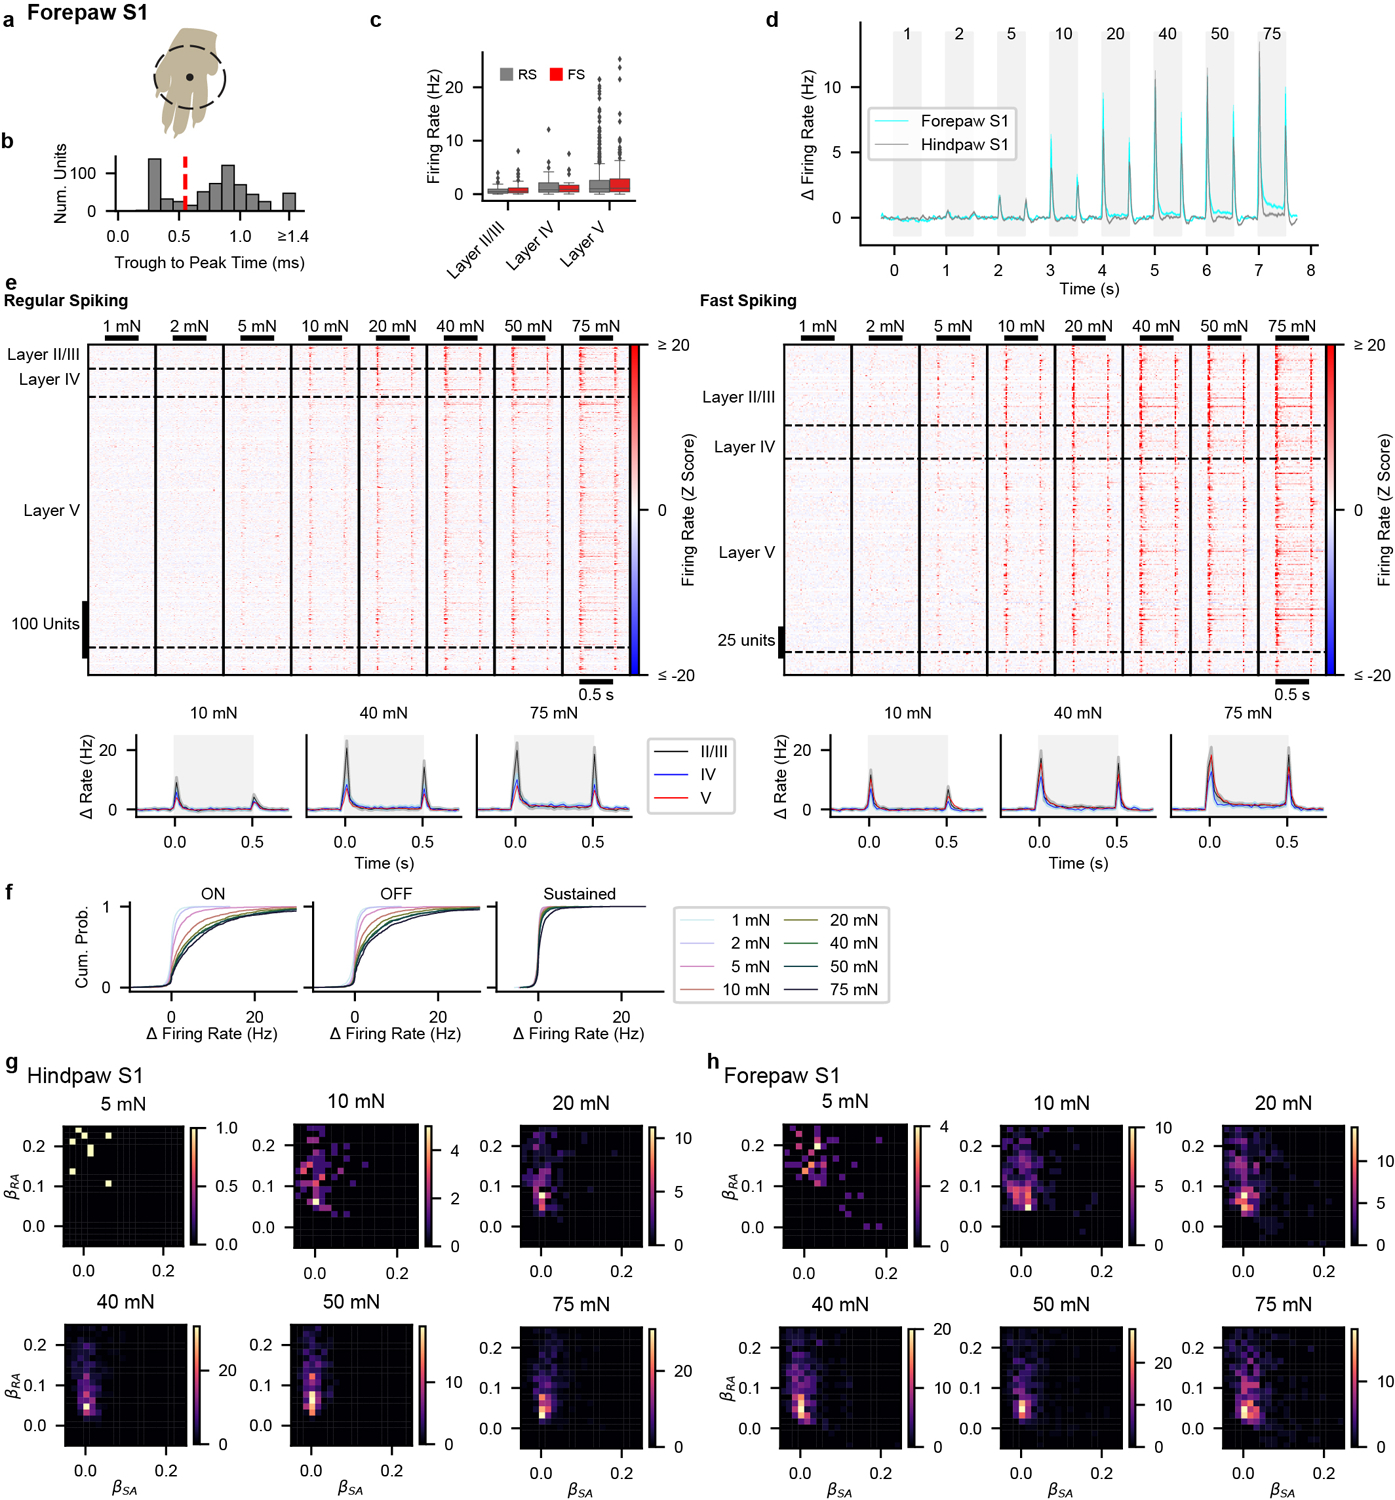
Extended Data Fig. 6: Forepaw S1 Responses to Step Indentation.

a, The forepaw was tethered over a 6.4-mm diameter circular aperture through which step indentations were applied to the glabrous skin of the forepaw.
b, Distribution of trough-to-peak times of action potential waveforms for forepaw S1 units. The dashed red line demarcates the threshold (0.55 ms) used for classifying RS from FS units.
c, Baseline firing rate for forepaw RS (n = 576 units from 12 recordings in 6 mice) and FS units (n = 258 units) from layers II/III, IV and V. Box plot element definitions: center line, median; box limits, upper and lower quartiles; whiskers, 1.5× interquartile range; points, outliers.
d, Grand mean (± s.e.m.) baseline-subtracted firing rate for all forepaw S1 units (cyan; n = 834) and all hindpaw S1 units (gray; n = 866) in response to step indentations. The shaded regions represent the timing of step indentations and the numbers at the stop signify the intensity of the indentation (in mN). While a sustained response is generated within forepaw S1 to high forces, this response is dwarfed by the transients at the onset and offset of the step indentations.
e, Top: Heatmaps of the Z-scored firing rate for forepaw S1 RS (left) and FS (right) units. Bottom: Grand mean firing rate (± s.e.m) for RS (left) and FS (right) units from each layer. Shaded region indicates timing of step indentation.
f, Cumulative distributions of baseline-subtracted firing rate for all forepaw S1 units at each step intensity for the onset (ON; 10–50 ms after step onset), offset (OFF; 10–50 ms after step offset), sustained (SUS; 250–500 ms after step onset) periods.
g, Sensitivity as measured by the I0 parameter for RS and FS units in each layer of forepaw S1 fit well (∑|residuals| < 1.2) with a saturating exponential. Number of units indicated on each bar.
h, Density histograms of the β coefficients for the Aβ RA-LTMR and Aβ SA-LTMR profiles that best fit hindpaw S1 units at forces designated above each plot. Heatmap colors represent number of units per bin. Only units with significant R2 values, as determined by permutation of the LTMR response profiles, were included.
i, As in h, for forepaw S1 units.
