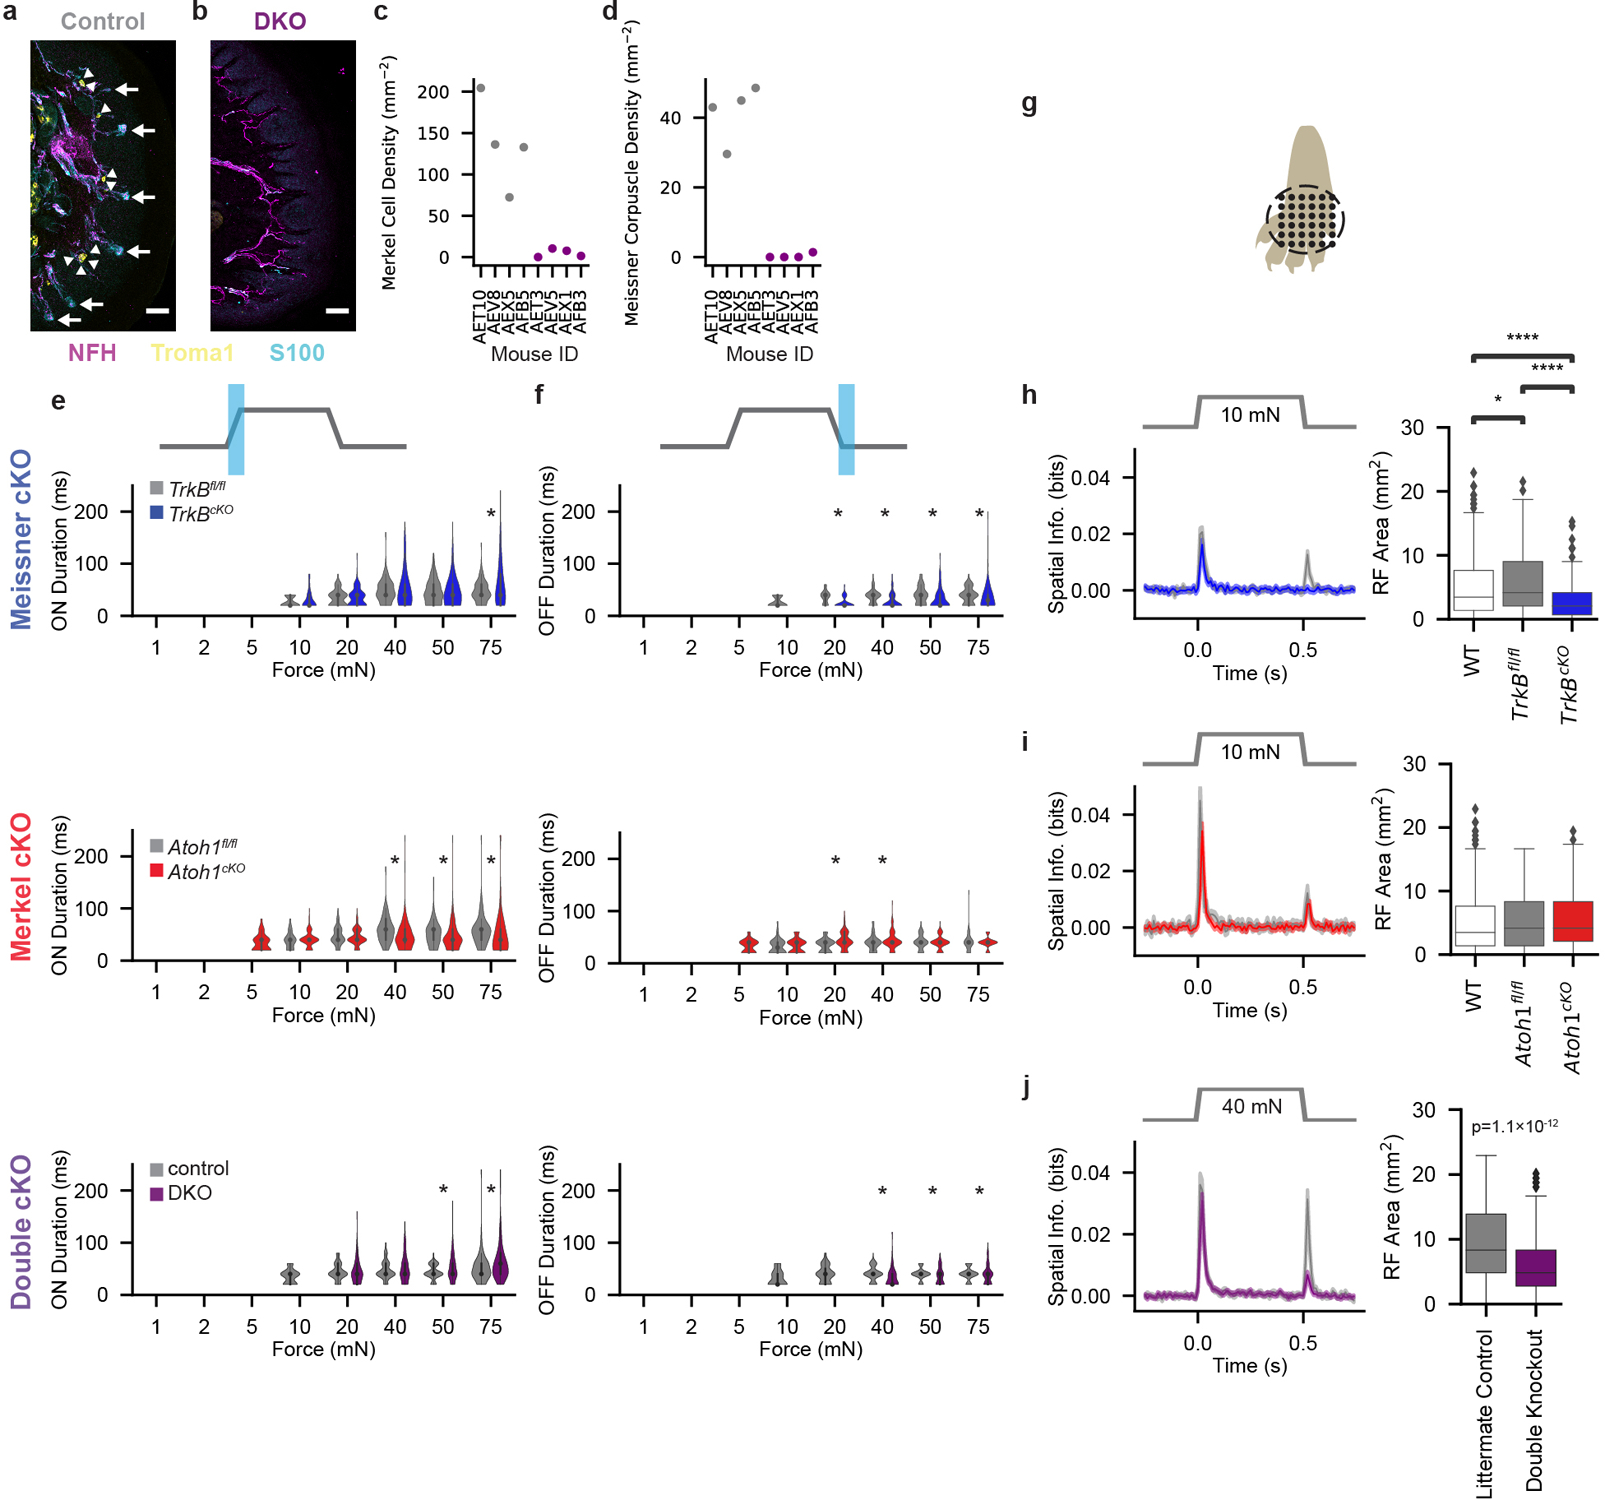
Extended Data Fig. 7: DKO Histology and S1 Receptive Fields and Response Durations in Knockout Mice.

a, Example pedal pad glabrous skin section in a littermate control (AET10) immunostained for NFH (magenta) to identify axons, Troma1 (yellow) to identify Merkel cells (indicated by arrowheads), and S100 (cyan) to identify Meissner corpuscles (indicated by arrows). Scale bar: 50 μm. Similar pattern observed in four littermate controls.
b, Pedal pad glabrous skin section in a DKO (AEV5) immunostained for NFH (magenta), Troma1 (yellow), and S100 (cyan). No Merkel cells or Meissner corpuscles were apparent in this section. Scale bar: 50 μm. Similar pattern observed in four DKOs.
c, Quantification of the density of Merkel cells within pedal pads for littermate controls (gray markers) and DKOs (purple markers).
d, Quantification of the density of Meissner corpuscles within pedal pads for littermate controls (gray markers) and DKOs (purple markers).
e, Durations of responses (violin plot shows kernel destiny estimate of underlying distribution) at the onset of step indentations (calculated by multiplying the number of consecutive bins with a Z score > 2 by the bin size [20 ms]) for hindpaw S1 units sensitive to each force in control TrkBfl/fl and TrkBcKO mice (top), in control Atoh1fl/fl and Atoh1cKO mice (middle), and in littermate controls and DKO mice (bottom). Plots shown only for forces to which at least 20 units responded at the indentation onset. *p < 0.05, Two-sided Mann-Whitney U test.
f, As in e, for responses at the offset of step indentations.
g, Schematic of RF measurements. 10-mN indentations were delivered to 36 locations in a 5 × 5 mm grid for wild-type animals, TrkBfl/fl controls, TrkBcKO mice, Atoh1fl/fl controls, and Atoh1cKO mice. 40-mN indentations were delivered at each location for DKOs and their littermate controls.
h, Mean (± s.e.m.) spatial information (left; blue: TrkBcKO, gray: TrkBfl/fl) and mean (± s.e.m.) RF areas (right) for S1 units from wild-type (n = 649 units), TrkBfl/fl (230 units), and TrkBcKO (182 units) animals. *p < 0.05, ****p < 0.0001, Two-sided Mann-Whitney U test, Bonferroni corrections for multiple comparisons applied.
i, As in h, for RF measurements in Atoh1fl/fl (gray; n = 48 units) and Atoh1cKO (red; 128 units) animals.
j, As in h, for RF measurements (made at 40 mN) in DKOs (purple; n = 369 units) and their littermate controls (gray; 217 units). Two-sided Mann-Whitney U = 5,412. Box plot element definitions (h-j): center line, median; box limits, upper and lower quartiles; whiskers, 1.5× interquartile range; points, outliers.
