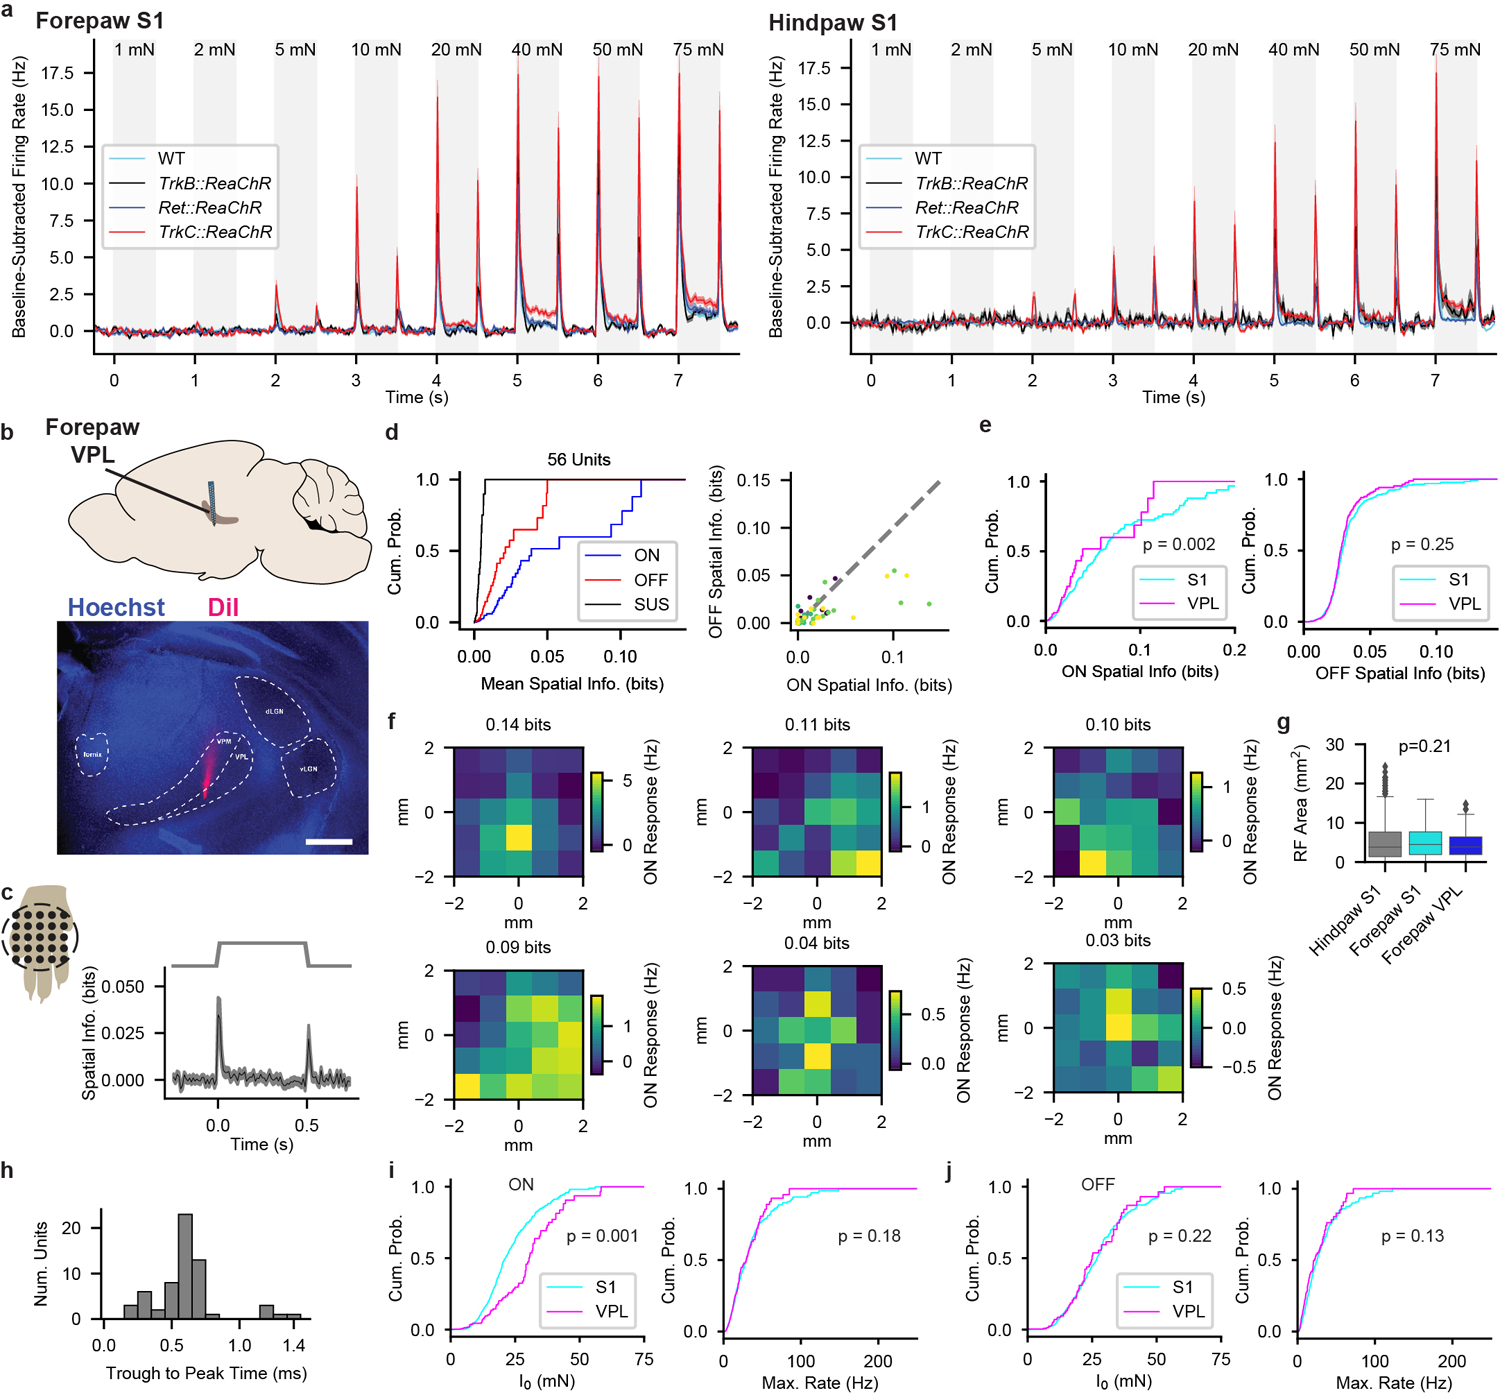
Extended Data Fig. 9: Response Profiles of S1 Units Sensitive to Selective Optogenetic Stimulation and Receptive Fields and Intensity-Response Relationships in VPL.

a, Grand mean (± s.e.m.) firing rate responses to step indentations for forepaw S1 (left) and hindpaw S1 (right) wild-type (cyan) units compared to that of units in each driver line that were responsive to optical stimulation. The response profiles are similar across all driver lines and wild-type units. Shaded regions indicate the timing of step indentations.
b, Top: Schematic of probe position within VPL. Bottom: Post-hoc histology showing the location of the electrode tract (DiI, red) in relation to thalamic structures. Hoechst 33258 nuclear stain shown in blue. Scale bar: 500 μm. Similar histology observed in 3 mice. VPL: ventroposterolateral nucleus of the thalamus, VPM: ventroposteromedial nucleus of the thalamus, dLGN: dorsal lateral geniculate nucleus, vLGN: ventral lateral geniculate nucleus.
c, Mean (± s.e.m.) spatial information of mechanically sensitive VPL units (n=56) in relation to 500-ms, 10-mN step indentations applied to 25 locations in a 4 × 4 mm grid.
d, Left: Cumulative distribution of mean spatial information of VPL units at the onset (ON; 20–70 ms after step onset), sustained (SUS; 250–500 ms after step onset), and offset (OFF; 20–70 ms after step offset) portions of the 10-mN step indentation. Right: The amount of information at the onset and offset is correlated (Pearson r = 0.70, p = 1.3 × 10⁻⁹).
e, Spatial information in VPL units (n = 56) and forepaw S1 units (n = 306) differs at the onset (left) but is indistinguishable at the offset (right) of the step indentation. Two-sided Mann-Whitney U = 6,520 and 8,071 for onset and offset comparisons, respectively.
f, RFs of example VPL units with varying amounts of mean spatial information at the onset of the step indentation, noted above each heat map.
g, RF area for S1 and VPL units (n = 850, 644, and 56 units for hindpaw S1, forepaw S1, and VPL, respectively). Kruskal-Wallis H = 3.12. Box plot element definitions: center line, median; box limits, upper and lower quartiles; whiskers, 1.5× interquartile range; points, outliers.
h, Distribution of action potential waveform trough to peak times for mechanically sensitive VPL units.
i, Sensitivity of VPL units compared to forepaw S1 units at the onset of the step indentation as assessed by I0 fits to saturating exponentials (left; n = 80 and 342 units for VPL and S1, respectively; U = 9,026) and maximum response firing rate (right; n = 174 and 599 units for VPL and S1, respectively; U = 51,650). Mann-Whitney U test.
j, Sensitivity of VPL units at the offset of the step indentation as assessed by I0 values (left; n = 64 and 316 units for VPL and S1, respectively; U = 9,502) and maximum response firing rate (right; n = 174 and 599 units for VPL and S1, respectively; U = 40,986). Mann-Whitney U test.
