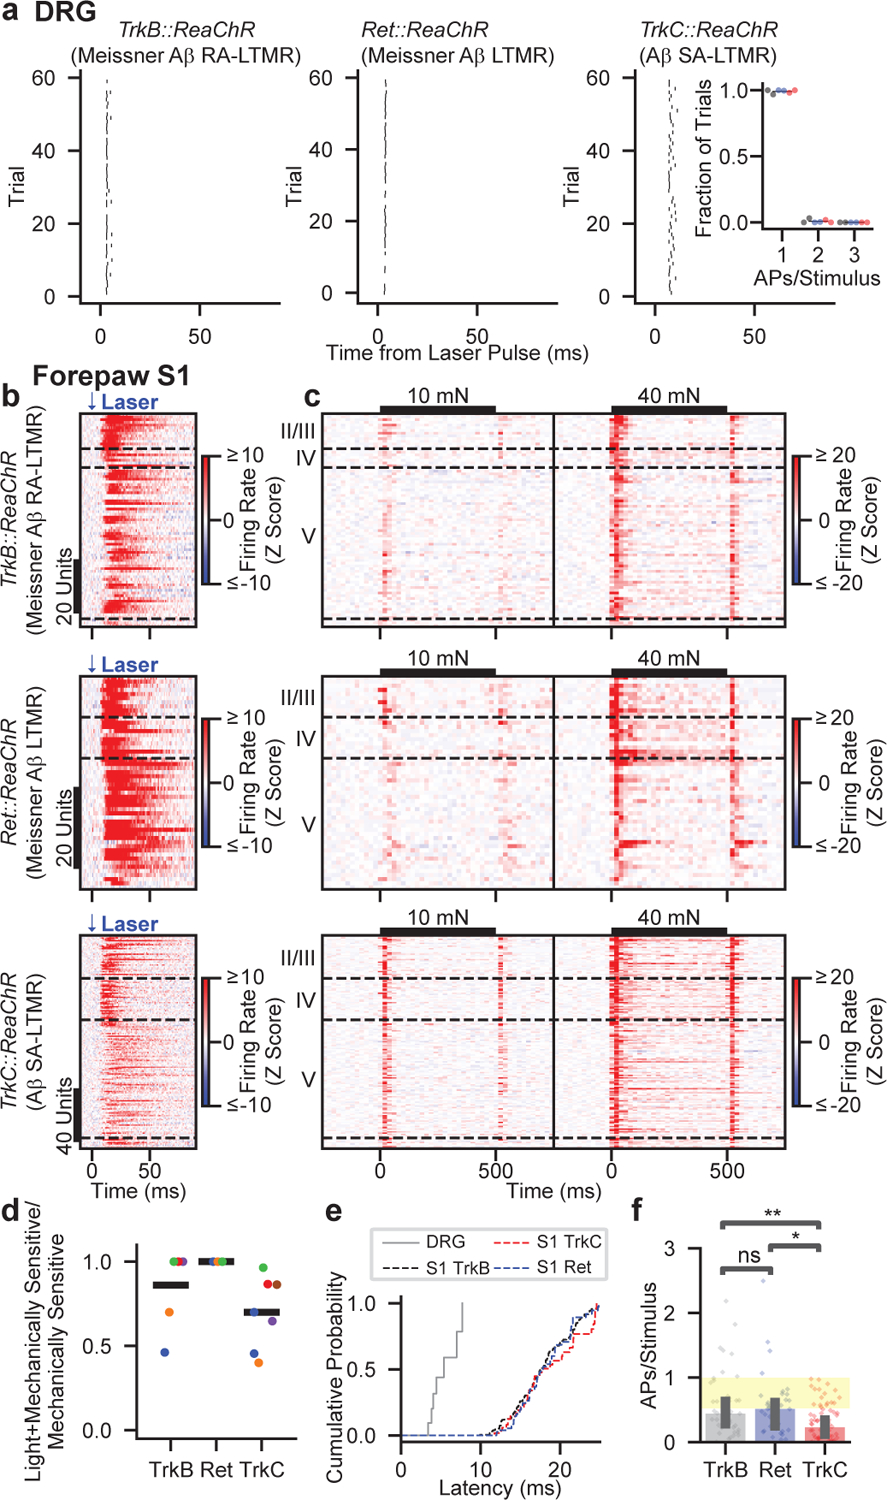
Fig. 3: Selective Activation of Aβ LTMR Subtypes Drives the Majority of Mechanically Sensitive S1 Neurons.

a, Rasters showing action potentials (APs) evoked by optical stimulation of the mechanical RF of ReaChR-expressing Aβ LTMRs from TrkB::ReaChR (left; labeling Meissner corpuscle-associated Aβ RA-LTMRs), Ret::ReaChR (middle; labeling Meissner corpuscle-associated Aβ LTMRs), and TrkC::ReaChR (right; labeling Merkel cell-associated Aβ SA-LTMRs) mice. Inset: proportion of pulses that evoked one, two, or three APs. Markers represent individual LTMRs (black: TrkB::ReaChR; blue: Ret::ReaChR; red: TrkC::ReaChR; 6 LTMRs), bars indicate mean.
b, Optical responses of 20-mN sensitive forepaw S1 units in TrkB::ReaChR (top; n=79 units, 6 recordings, 5 mice), Ret::ReaChR (middle; n=52 units, 5 recordings, 3 mice), and TrkC::ReaChR (bottom; n=159 units, 7 recordings, 6 mice) mice. Units sorted by depth. Dashed lines indicate layer boundaries.
c, Step-indentation responses of the forepaw S1 units in c. Note the different timescale.
d, Proportion of mechanically sensitive forepaw S1 units that respond to light. Markers represent individual recordings. Markers of the same color (within genotype) are from the same mouse. Bars represent means.
e, First-spike latency after optical stimulation recorded from Aβ LTMRs (within DRG) and from S1 units with a latency < 25 ms.
f, Evoked APs per stimulus for forepaw S1 units. Markers represent units, bars indicate medians, and error bars indicate 95% confidence intervals. Yellow-shaded region represents the range of values observed in Aβ LTMRs. H=13.86, p=0.00098, Kruskal-Wallis H test. Two-sided Mann-Whitney U tests corrected for multiple comparisons: **p=0.003, *p=0.016, ns p=0.94.
