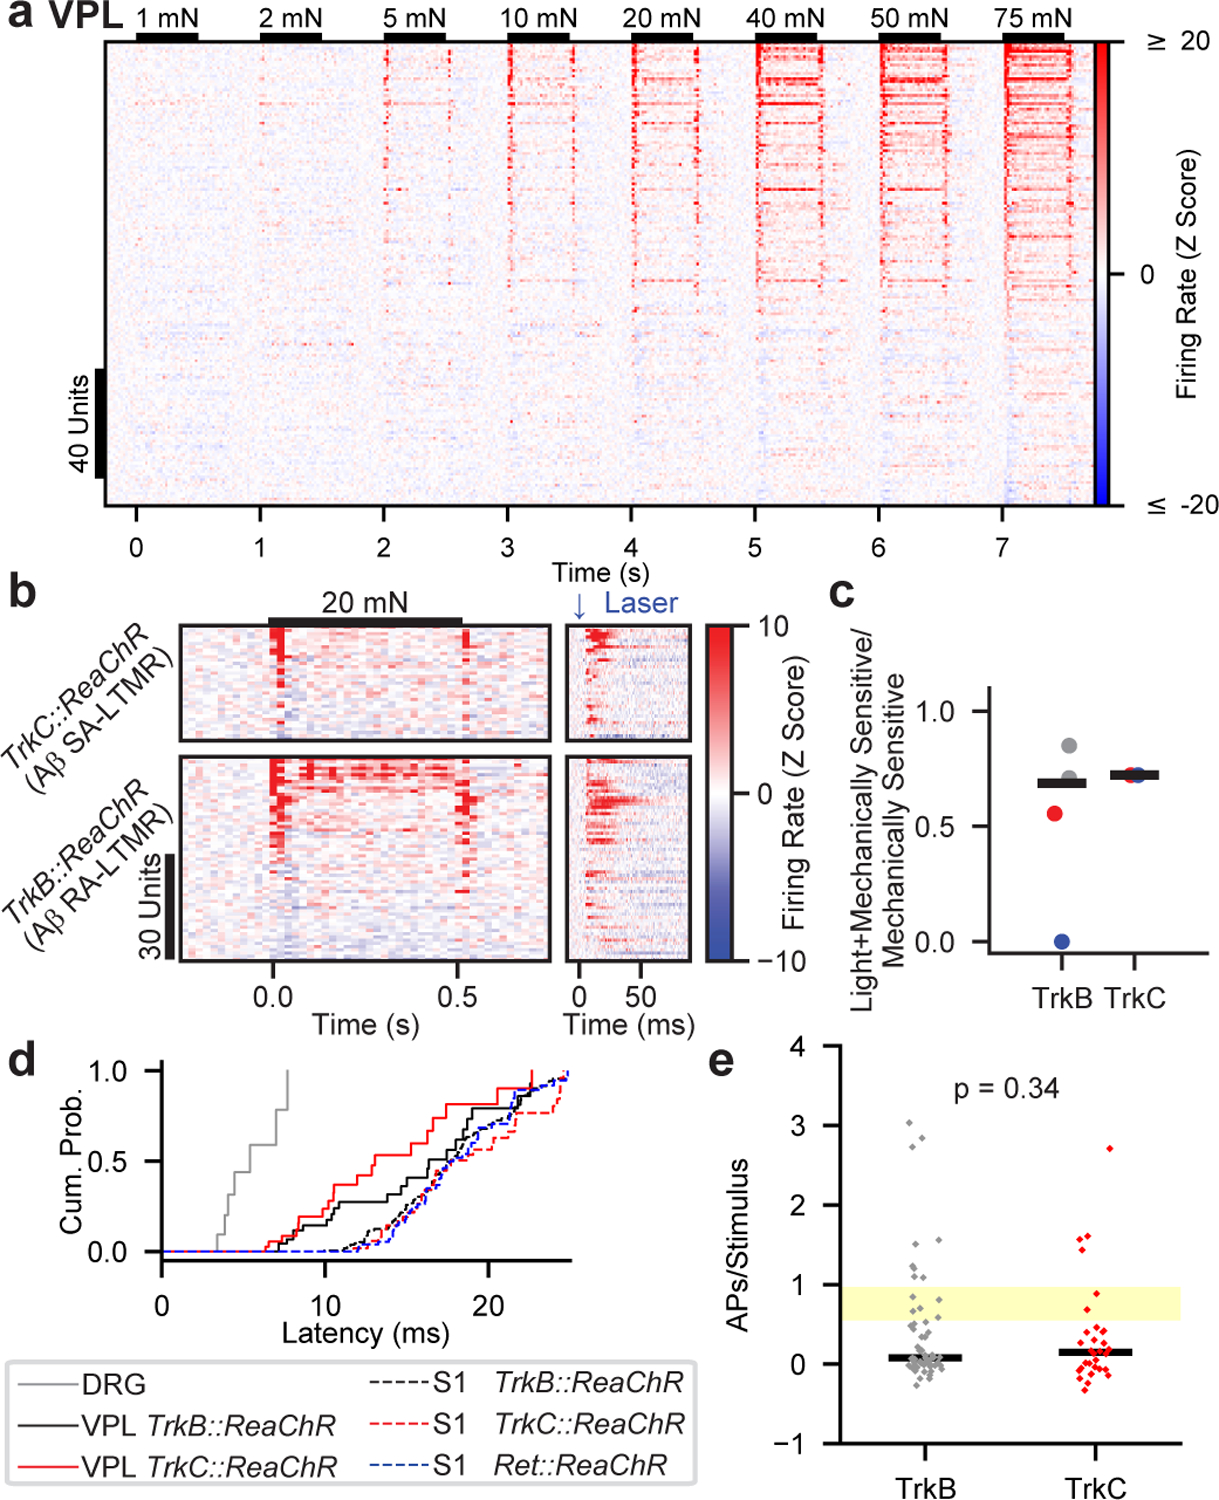
Fig. 4: Most VPL Neurons Receive Convergent Input from Aβ RA-LTMRs and Aβ SA-LTMRs.

a, VPL unit responses to 1–75 mN step indentations. Units sorted by 75-mN ON response.
b, Mechanical (left) and optical (right) responses in VPL units sensitive to 20-mN indentations. Optical responses driven by activation of TrkC+ Aβ SA-LTMRs (top; n=36 units, 2 recordings, 2 mice) or TrkB+ Aβ RA-LTMRs (bottom; n=64 units, 4 recordings, 3 mice). Sorted by response to indentation onset. Note the different timescales.
c, Fraction of mechanically sensitive VPL units that respond to optical activation of Aβ RA-LTMRs (via TrkB::ReaChR) and Aβ SA-LTMRs (via TrkC::ReaChR). Markers of the same color (within genotype) represent recordings from the same mouse. Bars represent means weighted by the number of units in each recording.
d, First-spike latencies measured in DRG, VPL, or S1 after optical stimulation of Aβ LTMRs.
e, Number of evoked spikes per pulse in each driver line for VPL units. Markers represent individual units and bars indicate medians. Yellow-shaded region represents range of values observed in Aβ LTMRs. Two-sided Mann-Whitney U=894.0.
