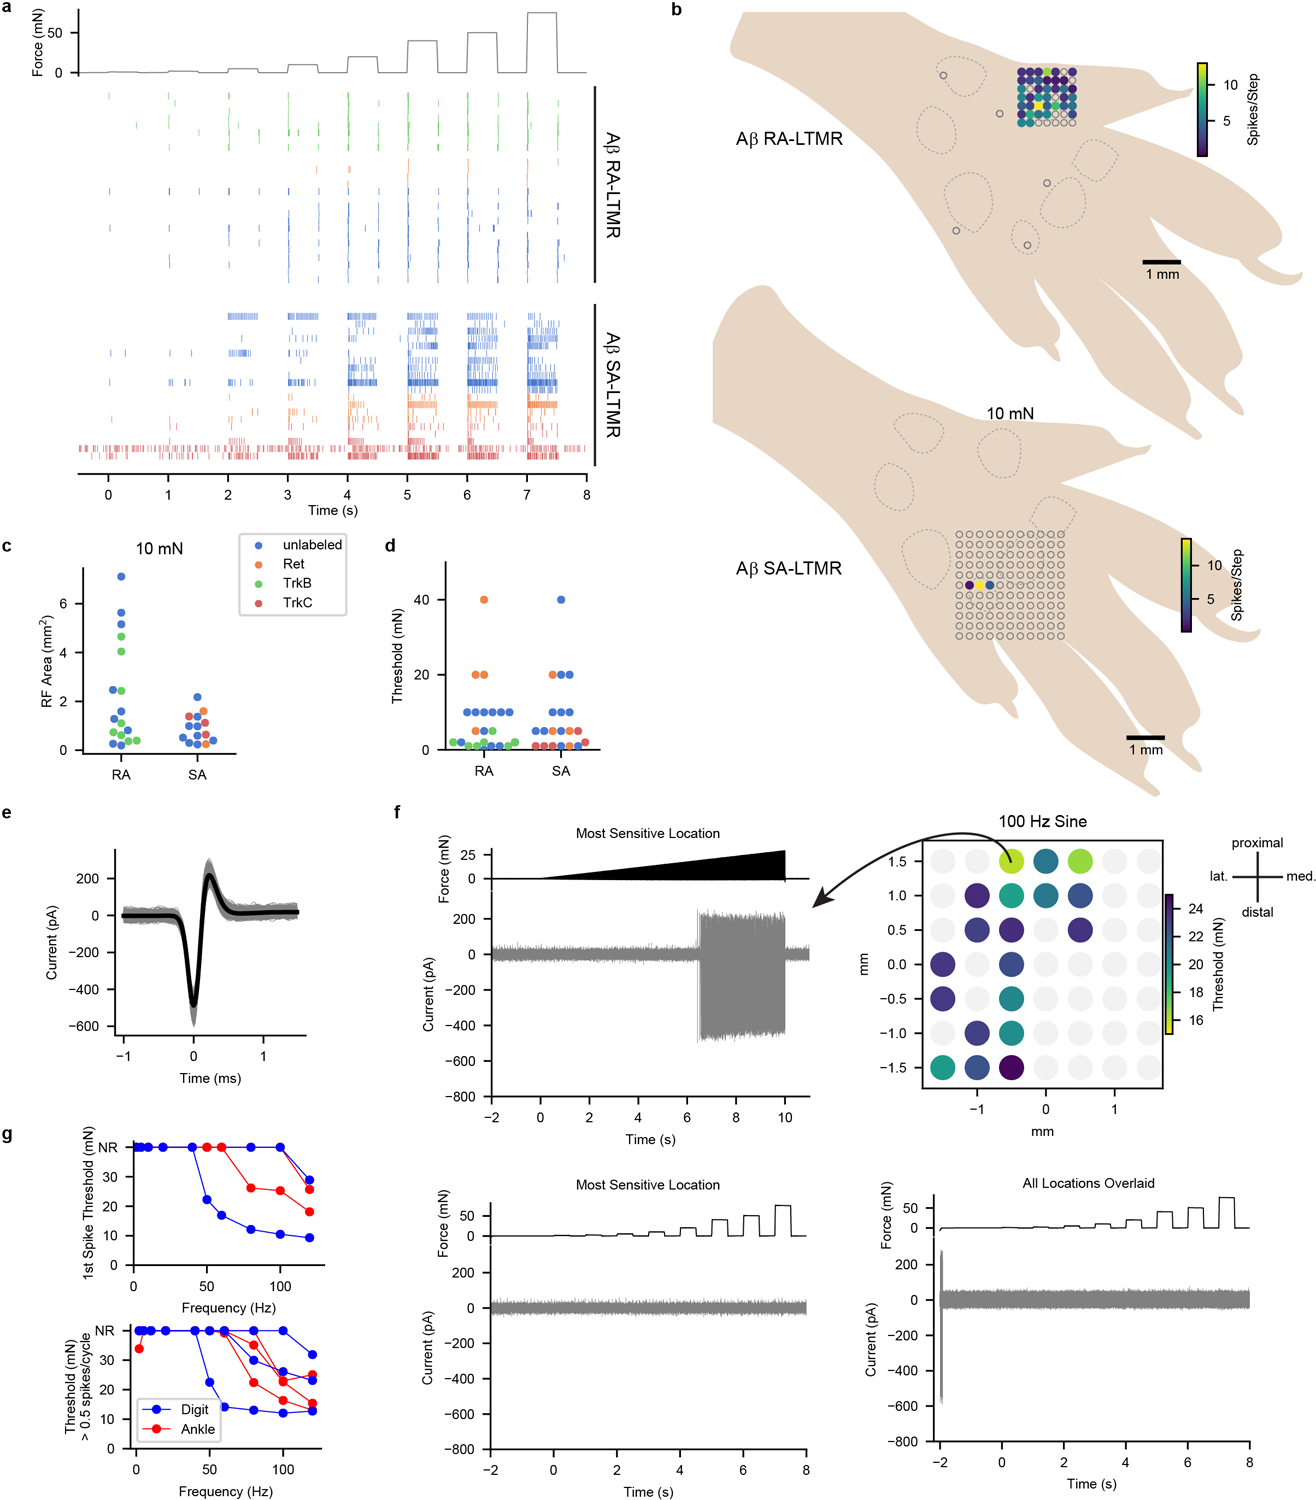
Extended Data Fig. 1: Aβ LTMR Responses to Force-Controlled Step Indentations.

a, Raster plot showing cutaneous Aβ RA-LTMR and Aβ SA-LTMR responses to a series of step indentations ranging from 1 to 75 mN applied to the most responsive skin region for each neuron. Markers are colored according to how the neurons were labeled (Blue, unlabeled; Orange, Ret+; Green, TrkB+; Red, TrkC+). A subset of these recordings (unlabeled neurons that were recorded in littermate controls for TrkBcKO mice, Ret+ neurons, and TrkB+ neurons) were previously published14.
b, Example RFs of an Aβ RA-LTMR (top) and an Aβ SA-LTMR (bottom) to 10-mN step indentations superimposed on a schematic of the hindpaw. Dashed lines outline pedal pads. Unfilled markers represent stimulus locations that did not evoke a response. Color represents the total number of action potentials evoked during the step indentation.
c, RF sizes for Aβ RA-LTMRs (n = 17) and Aβ SA-LTMRs (n = 14) that were responsive to 10-mN step indentations. Markers are colored according to how the neurons were labeled. Mean ± s.e.m. areas of 2.3 ± 0.5 and 0.9 ± 0.2 mm2 for Aβ RA-LTMRs and Aβ SA-LTMRs, respectively and median ± i.q.r. of 1.3 ± 3.4 and 0.8 ± 0.9 for Aβ RA-LTMRs and Aβ SA-LTMRs, respectively (Two-sided Mann-Whitney U= 81.0, p=0.07).
d, Force threshold for step indentation response for Aβ RA-LTMRs (n = 25) and Aβ SA-LTMRs (n = 20). Markers are colored according to how the neurons were labeled. Mean ± s.e.m. thresholds of 9.0 ± 2.1 and 9.2 ± 2.1 mN for Aβ RA-LTMRs and Aβ SA-LTMRs, respectively and median ± i.q.r. of 5.0 ± 8.0 and 5.0 ± 11.5 for Aβ RA-LTMRs and Aβ SA-LTMRs, respectively (Two-sided Mann-Whitney U=253.5, p=0.45).
e, Individual (gray) and mean (black) waveforms recorded from a Pacinian corpuscle-innervating Aβ LTMR labeled with a RetCreER;PVFlpO intersectional strategy (3 mg tamoxifen administered at embryonic day 11.5). These neurons were not labeled with dye-conjugated CTB, which was injected into the pedal and digit pads 48 h prior to recording.
f, A 100-Hz sine ramp stimulus was applied to multiple locations across the glabrous hindpaw to assess the responsive region for the Pacinian corpuscle-innervating Aβ LTMR. Top left: Response of neuron to most sensitive region. Top right: sine stimulus response threshold for each probed location. This Aβ LTMR likely innervated a Pacinian corpuscle in the ankle joint. Bottom left: Response to step indentations at most sensitive location. Bottom right: Response to step indentations at all locations overlaid. In some locations action potentials are generated as the probe initially comes into contact with the skin but are never generated in response to the step indentations (which were low-pass filtered at 33 Hz).
g, Frequency-response relationships for sine stimuli delivered in a ramp (top) or in a 1-s step (bottom). All Pacinian corpuscle-innervating Aβ LTMRs were most sensitive to high frequency stimulation. Ankle and digit terminal locations were inferred based on the regions of the paw that responded to a handheld vibrating metal probe. Ankle neurons (n = 3) responded when the probe was applied to most regions of the paw, including digits and pedal pads. Digit neurons (n = 3) only responded when the probe was applied to a single digit.
