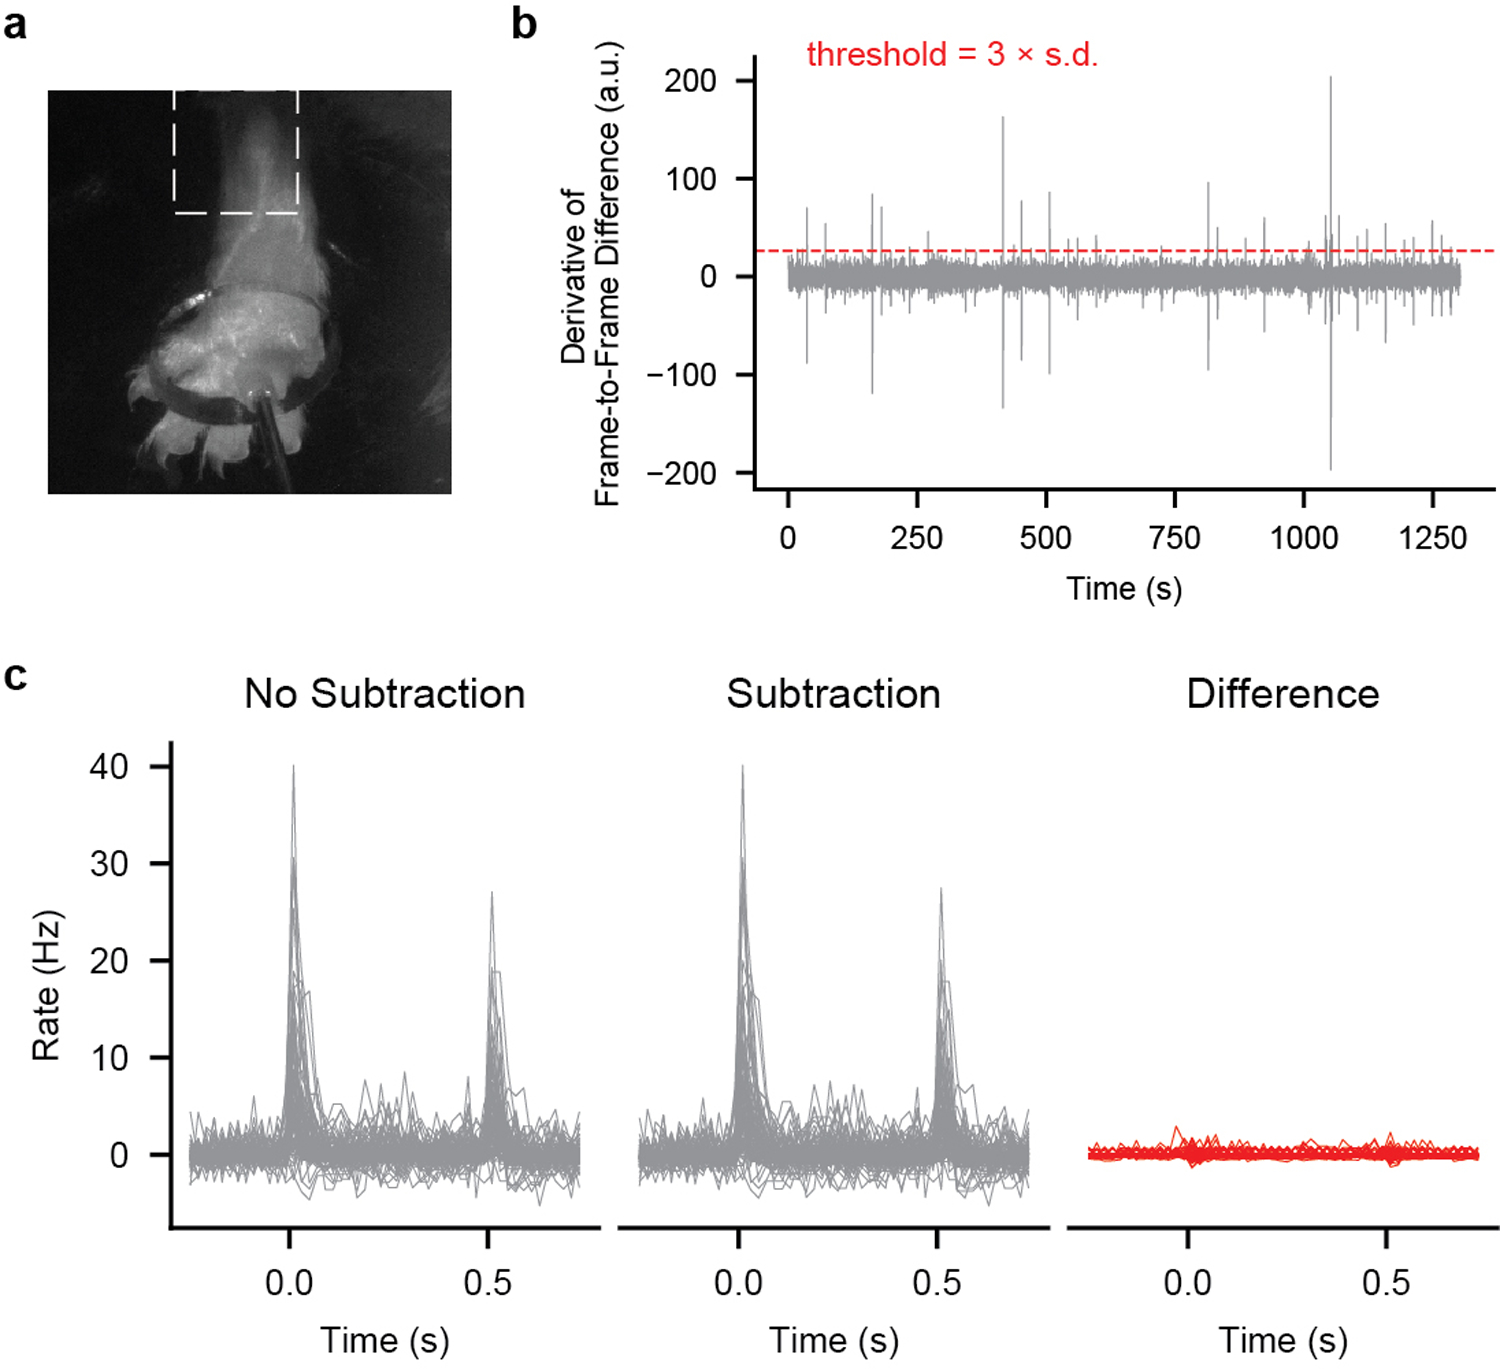
Extended Data Fig. 3: Movement Subtraction.

a, Frame of video (taken at 10 Hz) of paw during stimulation. Dashed box outlines region of interest (ROI) used for movement analysis. The ROI was binarized using Otsu thresholding and the difference from frame to frame was calculated.
b, The first derivative of the frame to frame difference for an example recording. When this derivative exceeded three standard deviations from 0.25 s before the step to 0.25 s after the step, the entire step was excluded from subsequent analyses.
c, Firing rate histograms in response to 75-mN step indentations (from 0 to 0.5 s) without (left) and with (middle) subtraction from the recording in b. The difference is shown on the right.
