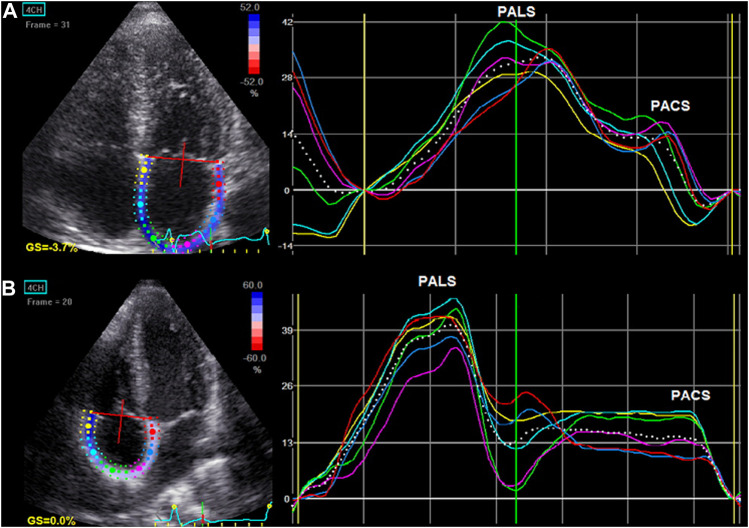
FIGURE 3.
Left atrial (A) and right atrial (B) longitudinal myocardial deformation by two-dimensional speckle tracking echocardiography (2D STE). The dashed curve depicts the average strain. The first positive peak of the curve is the peak atrial longitudinal strain (PALS), measured at the end of the reservoir phase. The second peak, just before the active atrial contraction, represents peak atrial contraction strain (PACS).

