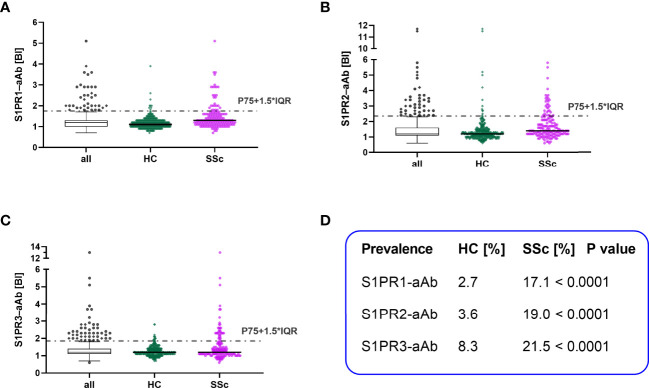
Figure 3.
Comparison of S1PR–aAb in healthy controls versus patients with systemic sclerosis. The presence of aAb to the three human S1PR (1–3) was determined in the group of healthy controls (HC) and patients with systemic sclerosis (SSc), and the relative prevalence was compared between both groups. Thresholds are indicated by dotted lines, and values are displayed as scattered dot plots. Black lines represent the median. Whiskers of the box plots denote P25 and P75. Results from HC are denoted in green and of SSc in pink. The prevalence for (A) S1PR1–aAb, (B) S1PR2–aAb, and (C) S1PR3–aAb was elevated in the patient cohort as compared to healthy controls. (D) A statistical comparison of SSc and HC for S1PR-aAb was conducted by two-sided Chi square test and revealed significant group differences.

