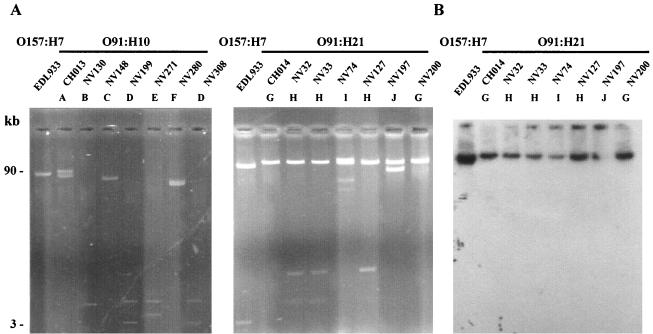
FIG. 3.
Representative plasmid profiles of the STEC strains. (A) Plasmid DNA of the O91:H10 and O91:H21 STEC strains. The profiles of OX3 isolates are not shown; these isolates produced plasmid profile G similar to the profile of O91:H21 strain CH014. The positions of molecular size standards are indicated on the left. (B) Southern blot hybridization of plasmid DNA of the O91:H21 strains with a specific ehxA probe. The strains and profiles are described in Table 3.

