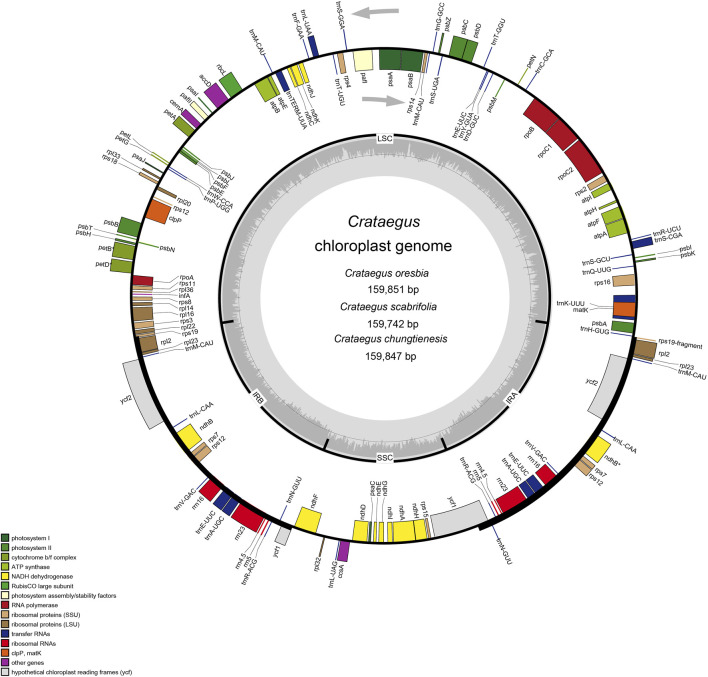
FIGURE 1.
Chloroplast genome maps of Crataegus (C. oresbia, C. scabrifolia, C. chungtienesis). In the diagram, different colors indicate genes with different functions. The genes inside circles are transcribed clockwise and genes outside circles are transcribed counterclockwise. Two inverted repeats (IRa and IRb), a large single copy region (LSC) and small single copy region (SSC) regions are shown in the inner circles. The light gray inner circles indicate A/T content and the dark gray circles indicate G/C content.

