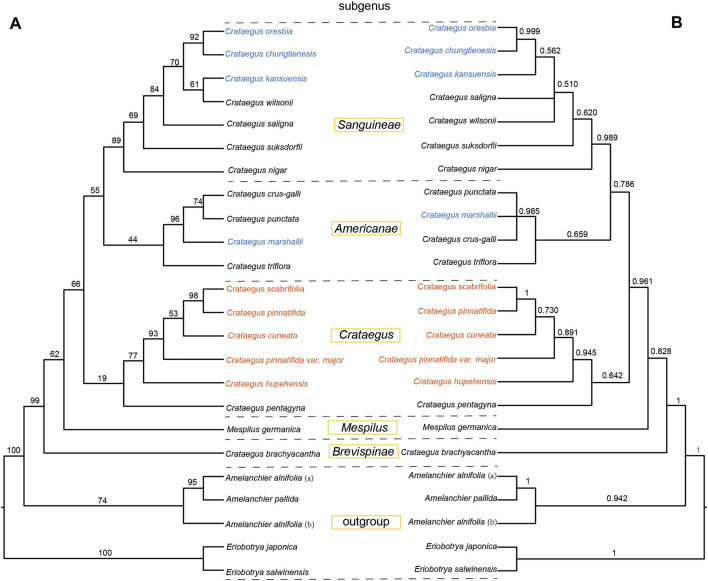
FIGURE 7.
Phylogenetic tree of Crataegus based on the sequences of five intergenic regions. The different colors represent the different evolutionary branches clades (clade A and clade B) in the phylogenetic tree constructed from the complete chloroplast genome. (A) Phylogenetic tree constructed by maximum likelihood (ML). (B) Phylogenetic tree constructed by maximum Bayesian method (BI).

