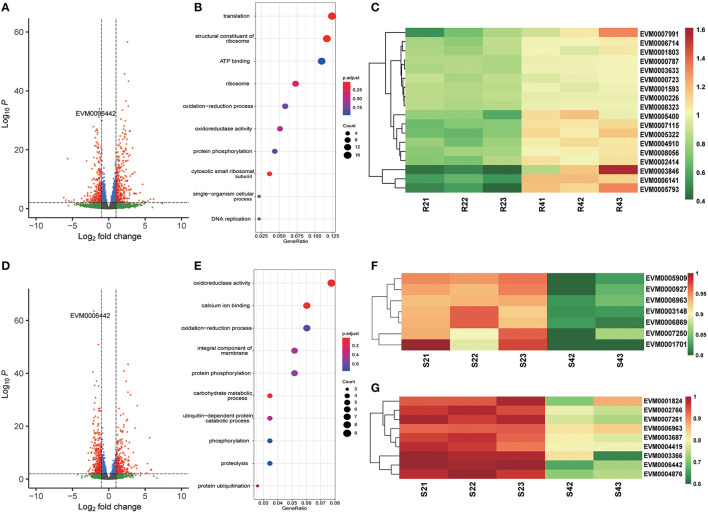
Figure 4.
Differential gene expression after 4 h of monensin treatment. Volcano plots showing differentially expressed genes in the monensin-resistant ETH-R strain (A) and the monensin-sensitive ETH-S strain (D) after 4 h of monensin treatment. Genes with an absolute fold change >2 and adjusted p < 0.01 were considered significantly differentially expressed (red dots). (B,E) Gene ontology enrichment of differentially expressed genes in ETH-R (B) and ETH-S (E) after two additional hours of monensin treatment (4 vs. 2 h). (C) Heatmap showing differentially expressed genes associated with ribosomal proteins in the monensin-resistant ETH-R strain after two additional hours of monensin treatment. (F,G) Heatmaps showing differentially expressed genes associated with calcium ion binding proteins (F) and oxidoreductive proteins (G) in the monensin-sensitive ETH-S strain after two additional hours of monensin treatment. For heatmap drawing, gene expression levels were transformed into normalized log2(TPM+1).

