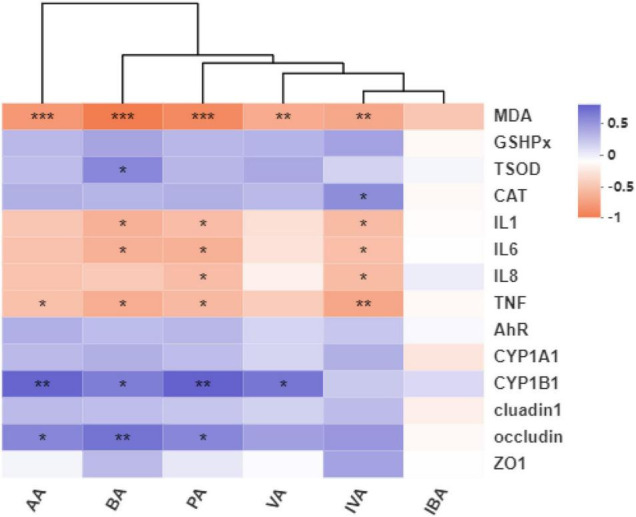
FIGURE 9.

Heat maps of the pearson correlation coefficient and significant tests between the gut microbial metabolite SCFAs and antioxidant capacity, expressions of colonic mucosa-related genes. AA, acetate; BA, butyrate; PA, propionate; VA, valerate; IVA, isovalerate; IBA, isobutyrate; MDA, malondialdehyde; GSHPx, glutathione peroxidase; TSOD, total superoxide dismutase; CAT, catalase; IL1, interleukin-1β; IL6, interleukin-6; IL8, interleukin-8; TNF-α, tumor necrosis factor-α; AhR, aryl hydrocarbon receptor; CYP1A1, cytochrome P4501A1; CYP1B1, cytochrome P4501B1; ZO1, zonula occludens-1; CON, control group; LPS-CON, piglets challenged with lipopolysaccharide; LPS-Trp, piglets fed with tryptophan and challenged with lipopolysaccharide. R values were shown in different colors in the figure. The color range of different R values was shown in the legend on the right. Values are shown as mean ± standard error (n = 6). *P < 0.05; **P < 0.01; ***P < 0.001.
