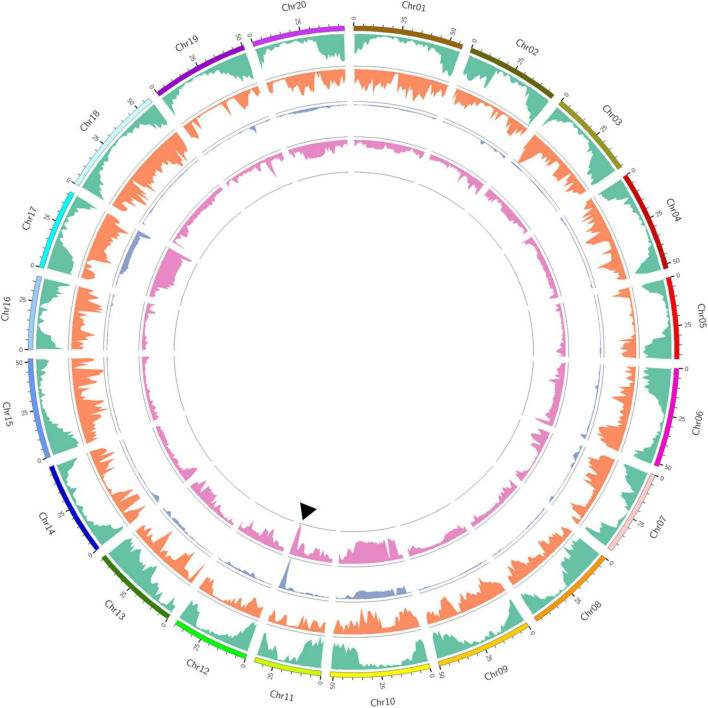
FIGURE 1.
Bulked segregant analysis (BSA)-seq analysis of the recombinant inbred line (RIL) population. Outer to inner circles: chromosome distribution, gene distribution (green color), single-nucleotide polymorphism (SNP) density distribution (orange color), euclidean distance (ED) value distribution (cyan color), and ΔSNP-index distribution (rose color). The solid triangle indicates the peak position of the overlapping genomic regions at Gm11 using both ED and ΔSNP-index methods.

