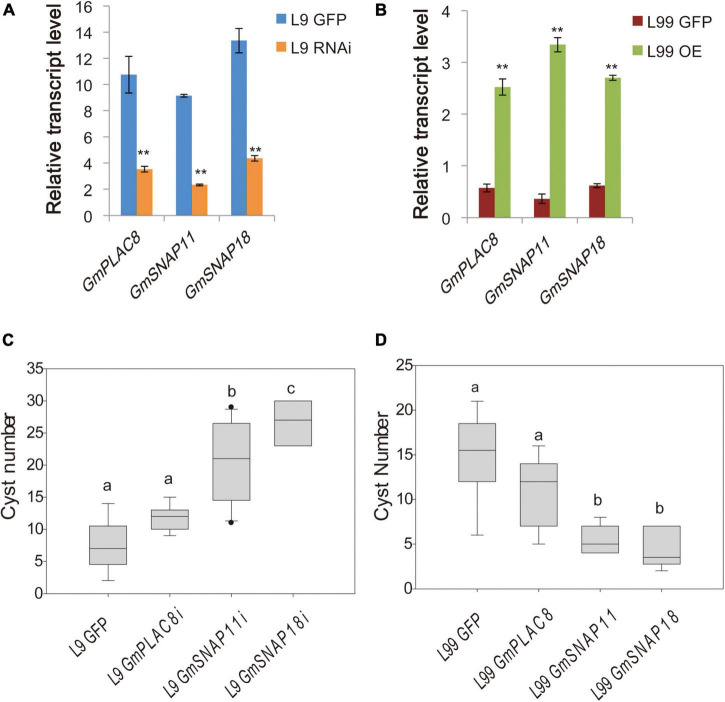
FIGURE 2.
Relative transcript levels and cyst counts in various lines. (A) Relative transcript levels in the RNAi and (B) overexpression lines. The mean and SE of nine samples are shown. ** represents a significant difference at P < 0.01. (C) Cyst counts in soybean cyst nematode 4 (SCN4)-resistant RIL L9 (rhg1+, Rhg4+, rhg1-paralog+) with suppressed expression (RNAi) of these genes and (D) SCN4-susceptible RIL L99 (rhg1+, Rhg4+, rhg1-paralog–) overexpressing these genes. The different letters above the boxes represent different significant levels at P < 0.05.

