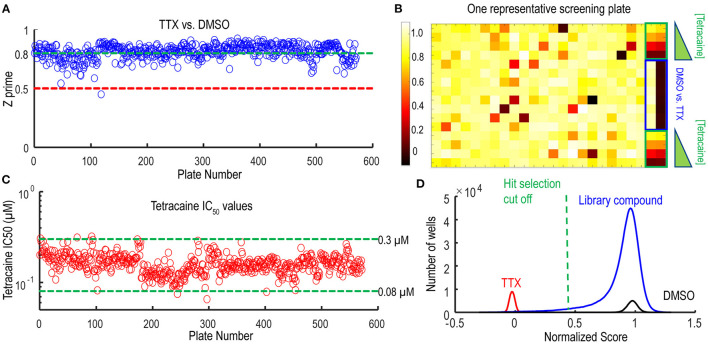
Figure 5.
Quality control metrics analysis for 200 K Nav1.7 spiking HEK Swarm screen. (A) The Z′ factor analysis for Nav1.7 Swarm screen. All 560 plates had Z′ factors at or above 0.5. (B) The heat map of one representative screening plate. Column 1 through Column 22 contained library compounds. Columns 23 and 24 contained control compounds, including 8 wells of TTX and 8 wells of DMSO for Z′ factor calculation and two 4-point titration series of tetracaine. (C) IC50 values derived from the 4-point tetracaine titration for each screening plate. The IC50 fluctuation was less than four-fold during the entire screen, indicating a high degree of assay consistency. (D) The histogram of library compounds and the control compounds. The normalized score of 0.45 was chosen for hit selection threshold, and based on this criterion, around 2,800 compounds were identified as hits from the 200 K Nav1.7 Swarm screen.

