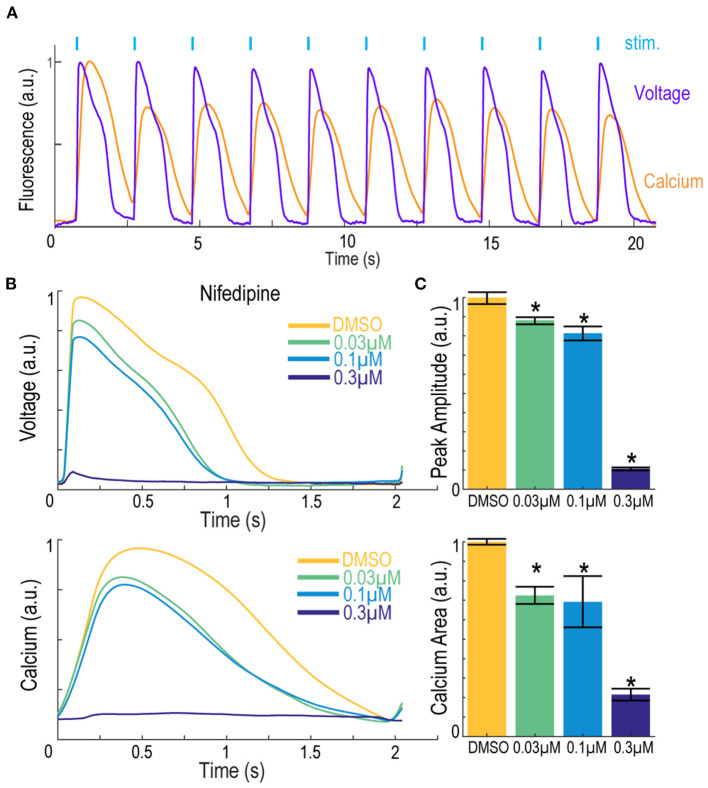
Figure 8.
Simultaneous voltage and calcium imaging with the Swarm instrument on hiPSC-derived cardiomyocytes. (A) Representative fluorescence traces from hiPSC-derived cardiomyocytes expressing jRGECO1a reporter and loaded with BeRST1 voltage sensitive dye. Cardiomyocytes were paced with ten 0.5 Hz, 20 ms blue pulses. (B) Average fluorescence waveforms for voltage and Ca2+ in hiPSC-derived cardiomyocytes treated with increasing concentrations of calcium channel blocker Nifedipine (yellow to dark blue). (C) Quantification of voltage AP peak amplitude and integrated Ca2+ waveform area. Data shown as mean from triplicate wells with ±SEM as error bars. *p < 0.05 compared to DMSO control.

