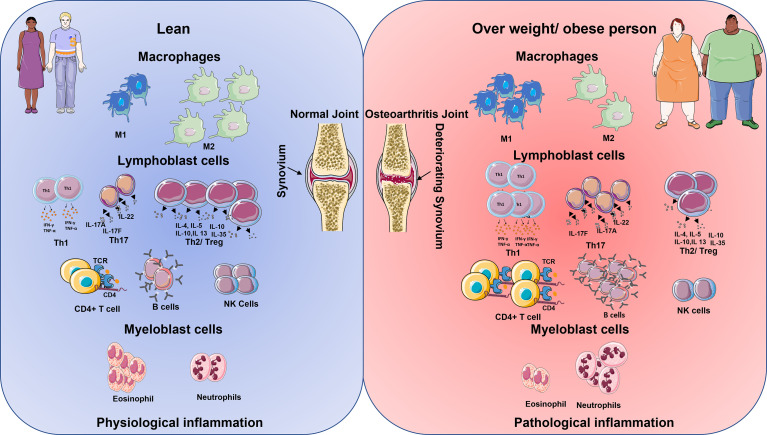
Figure 1.
Schematic diagram shows the immune cell being up and downregulated in lean and overweight/obese individuals. The cells on the left represent the lean physiological aspects of the immune system and on the right, the obese immune system (24). In lean population during inflamed condition the macrophages M1 cells are lower in comparison to M2 cells. However, the reverse is seen in the obese inflammation. Lymphoblastic cells like Th1, Th17, T helper, and B cells are lower in comparison with Treg cells and NK cells in lean inflammation population. However, in obese population, there is an increase in the production of Th1, Th17, T helper cells, B cells but reduction in the number of T reg cells and NK becomes low. Granulocytes like the eosinophiles are higher in comparison with neutrophiles in lean inflammation condition, however, the reverse is observed with obese population in their inflammatory condition.

