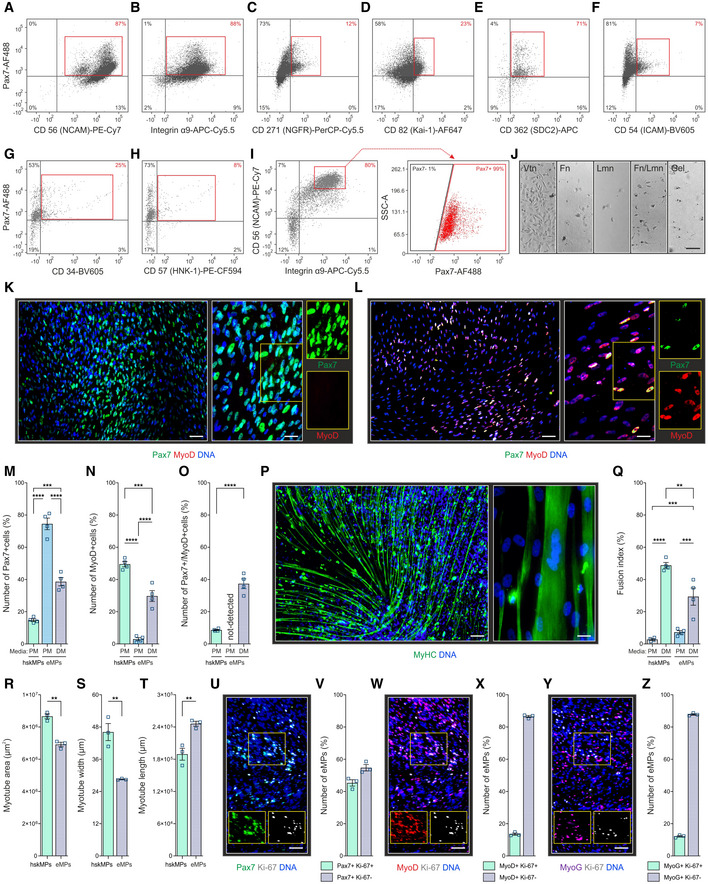
Figure 3. Purification and characterization of iTCE‐derived embryonic‐like myogenic progenitors (eMPs).

-
A–FFlow cytometry quantification for Pax7 and myogenic progenitor surface markers in cells derived from D13 iTCEs.
-
G, HFlow cytometry quantification of Pax7, CD34 marking human muscle progenitors with adipogenic potential, and the neural crest marker CD57 in cells derived from D13 iTCEs.
-
IFlow cytometry quantification of Pax7, integrin α9, and CD56 in cells isolated from D13 iTCEs.
-
JRepresentative brightfield images of the adhesion of integrin α9 and CD56 positive flow cytometrically sorted eMPs isolated from D13 iTCEs on vitronectin (Vtn), fibronectin (Fn), laminin (Lmn), and gelatine (Gel) in the presence of ROCK inhibitor.
-
KRepresentative immunostainings for Pax7 and MyoD in eMPs plated on Vtn and maintained in proliferation media (PM) after isolation.
-
LRepresentative immunostainings for Pax7 and MyoD in eMPs plated on Vtn that were first maintained in PM and then switched to differentiation media (DM).
-
M–OQuantification of the number of Pax7 (M), MyoD (N) and Pax7/MyoD double‐positive (O) cells in hskMPs and eMPs in PM and after switching to DM.
-
PRepresentative immunostaining for the muscle fiber marker myosin heavy chain (MyHC) of eMPs maintained in DM.
-
QQuantification of the fusion index of hskMPs and eMPs in PM and DM.
-
R–TQuantification of the total myotube area (R), myotube width (S), and myotube length (T) of hskMPs and eMPs in DM.
-
U–ZRepresentative immunostainings and quantification of eMPs in DM expressing Pax7 (V), MyoD (X), and MyoG (Z), as well as the proliferation marker Ki67.
Data information: K, L, P. Left‐hand scale bar = 75 μm, right‐hand scale bar = 50 μm. J. Scale bar = 40 μm. U, W, Y. Scale bar = 75 μm. M–O, Q–T, V, X, Z, Data are represented as means ± SEM from n = 4 (M–O, Q) and n = 3 (R–T, V, X, Z) independent experiments. A–I. Representative sorts of n = 3 repeats are provided in Appendix Table S6. A–Z. hiPSC donor 1. P‐values are *P < 0.05, **P < 0.01, ***P < 0.001, ****P < 0.0001 using ANOVA followed by a Bonferroni post hoc test.
