
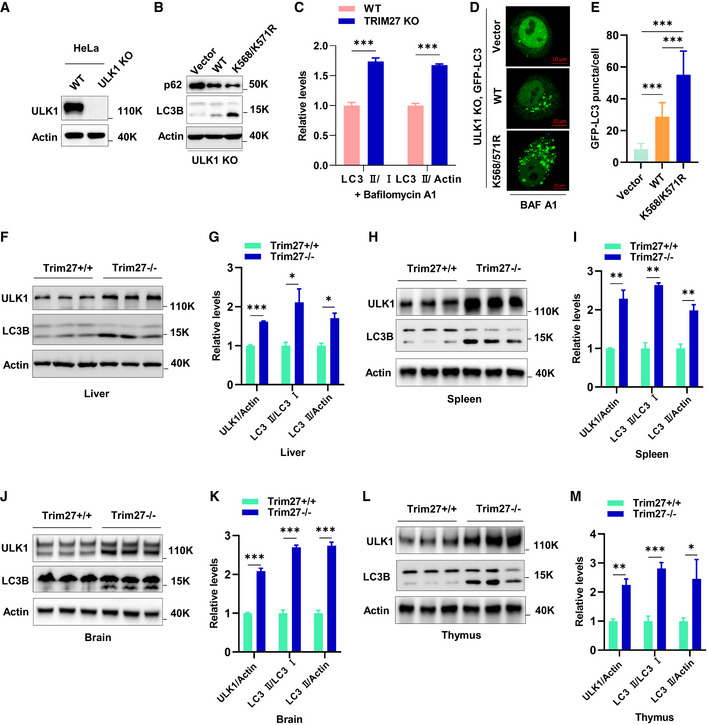
Figure EV2. Knockout of TRIM27 leads to an increase of autophagy in multiple tissues.
-
AVerification of ULK1 knockout in HeLa cells by Western blot.
-
Bp62 or LC3 levels in HeLa ULK1 KO cells co‐expressing vector control, HA‐ULK1 WT, or HA‐ULK1 K568/K571R.
-
CQuantification of LC3‐II/LC3‐I ratio, and LC3‐II/actin ratio with Bafilomycin A1 treatment related to Fig 3C. Data are mean ± SEM for three independent experiments. P‐values were determined by an unpaired t‐test with Holm‐Sidak’s method for multiple t‐tests, ***P < 0.001.
-
DRepresentative images of GFP fluorescence localization in HeLa ULK1 KO cells co‐expressing GFP‐LC3 together with vector control, HA‐ULK1 wildtype, or HA‐ULK1 K568/K571R, respectively.
-
EQuantitation of data presented in (D) shows mean number of GFP‐LC3 puncta per cell ± SD (n = 30 cells per condition). P‐values were determined by a one‐way ANOVA with Tukey’s multiple comparisons test, ***P < 0.001.
-
F, GWestern blot analysis of ULK1 accumulation and LC3 conversion in the liver of 3‐month‐old Trim27+/+ and Trim27−/− mice. Each lane represents a different mouse (F). Quantification of ULK1, LC3‐II/LC3‐I, and LC3‐II/actin ratios in F (G).
-
H, IWestern blot analysis of ULK1 accumulation and LC3 conversion in the spleen of 3‐month‐old Trim27+/+ and Trim27−/− mice. Each lane represents a different mouse (H). Quantification of ULK1, LC3‐II/LC3‐I, and LC3‐II/actin ratios in H (I).
-
J, KWestern blot analysis of ULK1 accumulation and LC3 conversion in the brain of 3‐month‐old Trim27+/+ and Trim27−/− mice. Each lane represents a different mouse (J). Quantification of ULK1, LC3‐II/LC3‐I, and LC3‐II/actin ratios in J (K).
-
L, MWestern blot analysis of ULK1 accumulation and LC3 conversion in the thymus of 3‐month‐old Trim27+/+ and Trim27−/− mice. Each lane represents a different mouse (L). Quantification of ULK1, LC3‐II/LC3‐I, and LC3‐II/actin ratios in L (M).
Data information: (G, I, K and M) Data are mean ± SEM for three mice per genotype. P‐values were determined by an unpaired t‐test with Holm‐Sidak’s method for multiple t‐tests, *P < 0.05, **P < 0.01; ***P < 0.001.
Source data are available online for this figure.