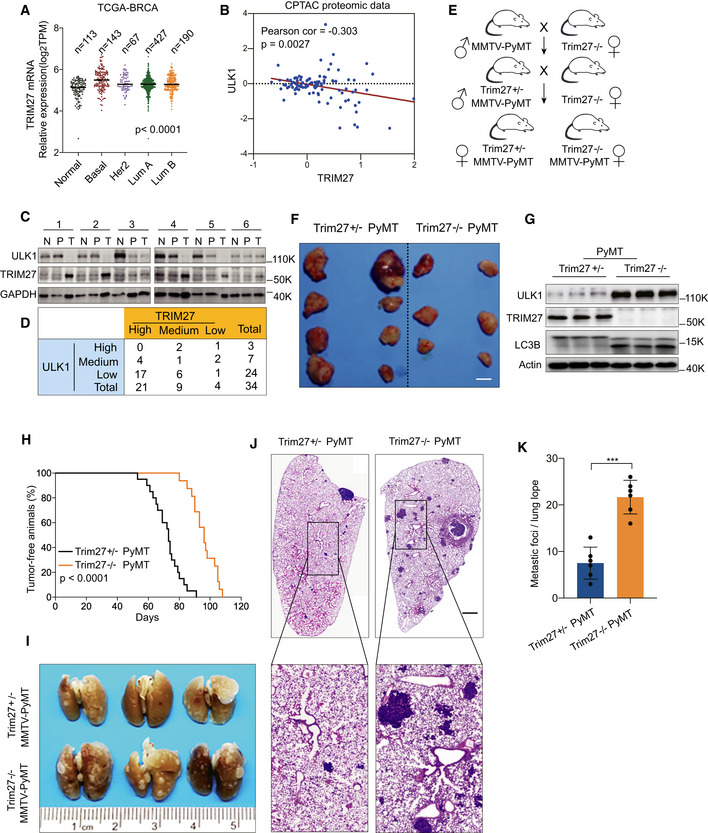
Figure 6. Knockout of Trim27 inhibits breast tumorigenesis but promotes lung metastasis in PyMT mice.

-
AComparison of the relative mRNA levels of TRIM27 in normal breast tissues (Normal, n = 113) and indicated breast tumors (Basal, n = 143; Her2, n = 67; LumA, n = 427; LumB, n = 190) in the TCGA database. The number of biological replicates are shown as indicated. P < 0.0001 (one‐way ANOVA).
-
BAnalysis of the correlation between ULK1 and TRIM27 expression in the CPTAC proteomics database. P = 0.0027 (Pearson’s correlation method).
-
C, DWestern blot analysis of ULK1 and TRIM27 levels from tumor tissues (T), Pericarcinomatous tissues (P), and their matched surrounding normal tissues (N). GAPDH was used as a loading control (C). A total of 34 samples of human breast cancer were classified into nine groups based on the expression of ULK1 and TRIM27 in tumor tissues compared with surrounding normal tissues (D).
-
ESchematic diagram of Trim27−/− PyMT and Trim27+/− PyMT mice breeding, Trim27+/− PyMT mice as a littermate control.
-
FRepresentative tumors in MMTV‐PyMT mice of the indicated Trim27 genotypes. Scale bar, 5 mm.
-
GWestern blot analysis of indicated proteins in Trim27−/− PyMT or Trim27+/− PyMT mice in primary breast tumors. Actin was used as a loading control.
-
HKaplan–Meier tumor‐free survival curves of Trim27+/− PyMT (median = 75 days, number = 20), or Trim27−/− PyMT mice (median = 95 days, number = 16). P < 0.0001 (Mantel–Cox test).
-
I–KPulmonary surface nodules and hematoxylin and eosin (H&E) staining in Trim27+/− PyMT mice and Trim27−/− PyMT mice (I and J). Scale bar, 1 mm (K). Bar chart showing quantification for the number of metastatic nodules per lung lope (Trim27+/−, n = 6 mice; Trim27−/− n = 6 mice), when compared at the same final timepoint. Each symbol represents a mouse; Data are presented as mean ± SD from three independent experiments; ***P < 0.001 (unpaired student's t‐test).
Source data are available online for this figure.
