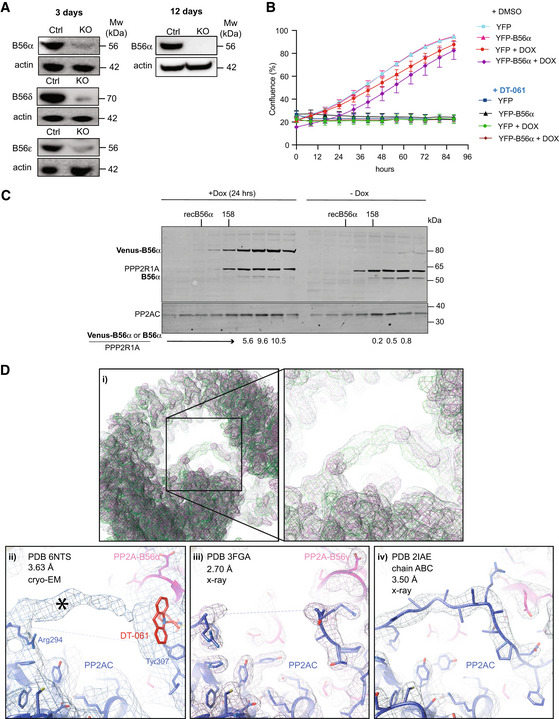
Figure EV2. In vivo and structural analysis of drug activity on cells.

- CRISPR‐Cas9‐inducible HeLa cell lines for PP2A regulatory subunits. Western blotting shows the removal of the indicated B56 subunits 3 and 12 days after addition of doxycycline, respectively. Actin was used as loading control. At least three biological replicates of the experiment were performed.
- Incucyte growth assay using a HeLa cell line stably expressing inducible YFP‐B56α. Induced cells were treated with Doxycycline for 12 h before imaging. Cell was treated with 20 µM DT‐061 or DMSO (Ctrl). Experiment was repeated in three times independently of each other with each experiment performed in technical triplicate. A representative independent experiment is shown with mean and SD.
- A total cell extract was prepared from HeLa cells stably expressing doxycycline‐inducible YFP‐B56α. Cells were either untreated or expression induced for 24 h with Doxycycline and the complexes in the cell extracts separated on a Superdex200 column. The migration of molecular weight markers or recombinant untagged B56α is indicated on top. The fractions were analyzed by quantitative Licor western blot for PP2A/A, B56α and PP2A/C. The ratio of B56α or Venus‐B56α to PP2A/A in the peak fractions is shown below. PP2AC levels co‐migrating with PPP2R1A increased 2–3‐fold in the sample where YFP‐B56α was induced. Experiment was performed once.
- (i) The superposition of the crystallographic electron densities maps of PDB 2IAE chain a,b,c (green) and PDB 3FGA (light pink) with cryo‐EM map EMD‐0510 (gray) at a map threshold of 0.25 shows that in all three maps, density is protruding into the center of the horseshoe‐shaped PP2A holoenzyme at the same position (closeup, right). The fits of all three PP2A structures—PDB 6NTS (ii), PDB 3FGA (iii) and PDB 2IAE, (chain a,b,c) (iv) —into their respective densities show that in all three cases, this area of density was attributed to the C‐terminal tail of the PP2A catalytic subunit. In the case of PDB 6NTS, the overall map quality and local resolution in that area reveals less easily interpretable features than in the case of PDBs 3FGA/2IAE. Only the last three C‐terminal tail residues (307‐9) were built, and the DT061 ligand (red) was modeled right next to them. This leaves most of the visible extra density (asterisk) uninterpreted (ii), in a position where in the higher resolution models of PP2A/C (3FGA/2IAE) further residues of the PP2A/C C‐terminus have been placed.
