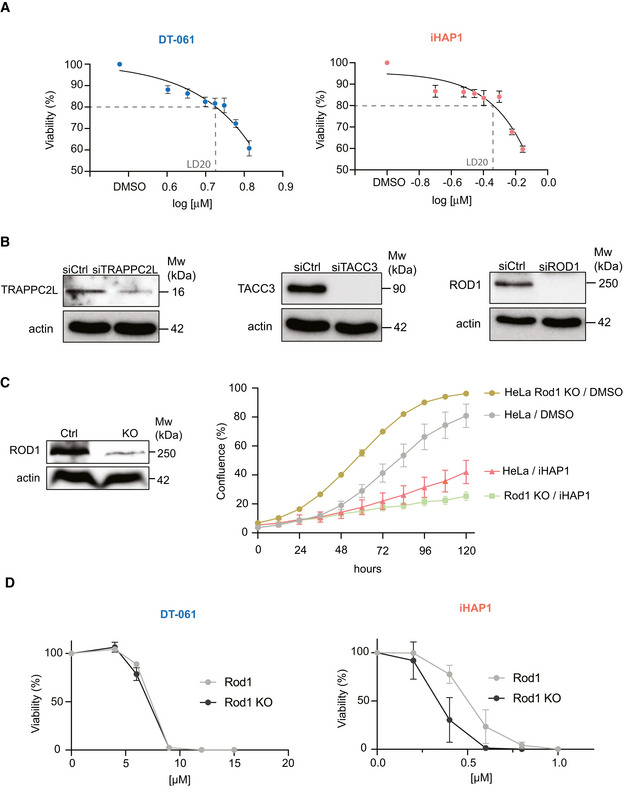
Figure EV3. Compound titration and validation of CRISPR screen results.

- Viability of RPE1‐hTERT P53−/− FLAG Cas9 cells with increasing concentrations of iHAP1 or DT‐061 to determine LD20. Mean and SD of three biological replicates is shown.
- Protein depletion efficiency after RNAi‐treatment. Actin was used as loading control. The experiment was performed three times.
- Sensitivity of HeLa Rod1 KO cells to 0.5 µM iHAP1. Western blot to confirm Rod1 depletion levels (left) and growth curves for the indicated conditions (right).
- Sensitivity of HeLa Rod1 KO to DT‐061 or iHAP1 determined using SRB assay.
Data information: (C and D) Mean and SD of three independent experiments are shown.
