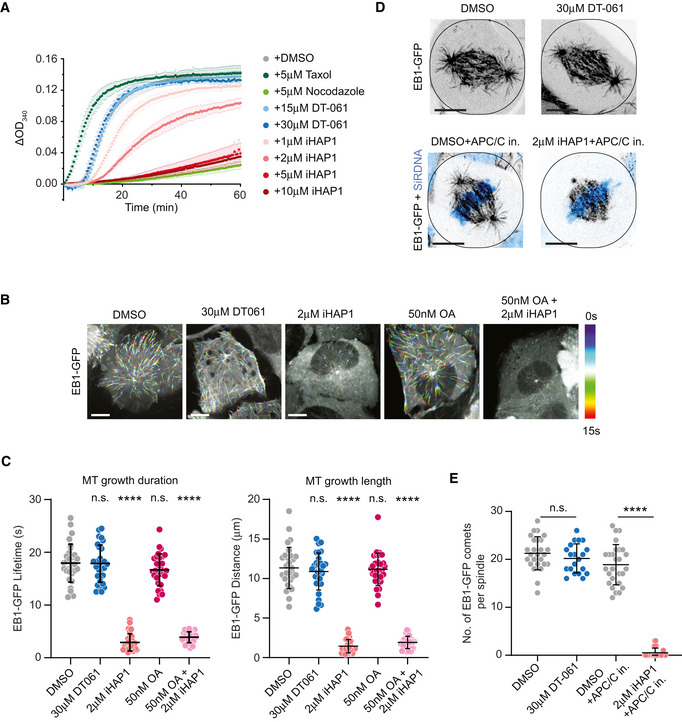
Figure 4. iHAP1 is a microtubule poison.

- In vitro tubulin polymerization assay showing concentration dependent effect of iHAP1 on polymerization dynamics. Taxol and Nocodazole served as controls for the experimental setup. The assay was performed in the presence of the indicated drug concentrations. Mean and SEM are shown from three to six independent experiments.
- Representative color‐coded temporal projection of U2OS EB1‐GFP cells following indicated treatment. Scale bar 10 µm.
- Quantification of microtubule dynamics acquired from manual tracking of EB1‐GFP comets as indicators for MT growth after drug treatment. The mean and SD are plotted from three independent experiments (n = 10 cells per experiment).
- Representative temporal projection of mitotic spindles of U2OS EB1‐GFP cells following specified treatment. DNA counterstained with SiR‐DNA shown in cyan in merged images. Scale bar 10 µm.
- Analysis of number of EB1‐GFP comets per mitotic spindle. The mean and SD are plotted from three independent experiments (Total number of cells = 26 (DMSO), 20 (30 µM DT‐061), 27 (DMSO+APC/C in.) and 26 (2 µM iHAP1+APC/C in.)).
Data information: P‐values were calculated using Student’s t‐test or Mann–Whitney U test (unpaired, two‐tailed). See Materials and Methods for more details. ns, not significant, ****P < 0.0001.
Source data are available online for this figure.
