
Figure EV4. Analysis of mitotic phenotypes in cells treated with DT‐061 or iHAP1.
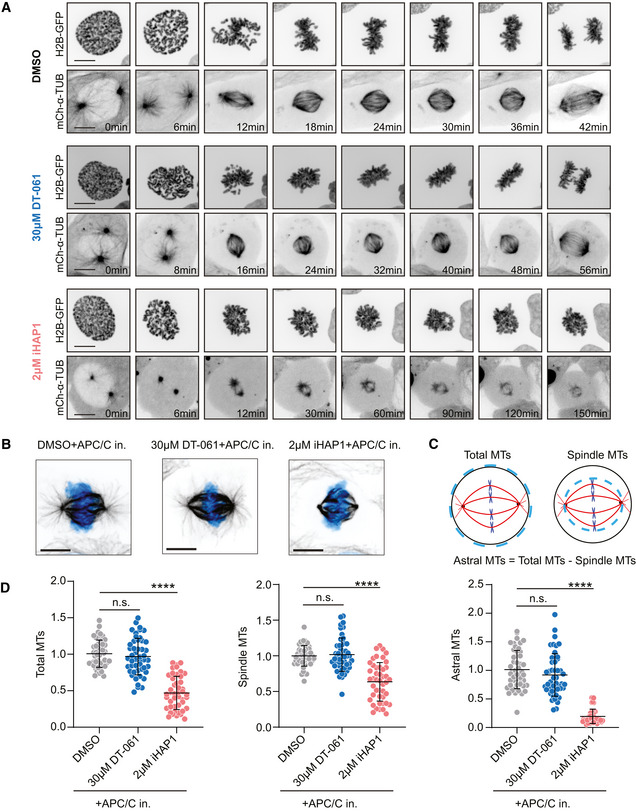
- Representative spinning‐disk confocal microscopy time‐series of mitosis in U2OS cells stably expressing H2B‐GFP/mCherry‐α‐tubulin following indicated treatments. Scale bar indicates 10 µm.
- Representative images of U2OS mitotic spindles in metaphase following indicated treatments, immunostained with α‐tubulin antibody. DNA was counterstained with DAPI (cyan). Scale bar indicates 10 µm.
- Illustration describing the method used for measuring the amount of total, spindle and astral microtubules.
- Quantification of the number of microtubules in metaphase‐arrested mitotic cells following indicated treatments. The mean and SD are plotted from three independent experiments (Total no. of cells = 48 (DMSO), 45 (30 µM DT‐061+APC/C in.) and 48 (2 µM iHAP1+APC/C in.)). P‐values were calculated using Student’s t‐test or Mann–Whitney U test (unpaired, two‐tailed). See Materials and Methods for more details. ns, not significant, ****P < 0.0001.