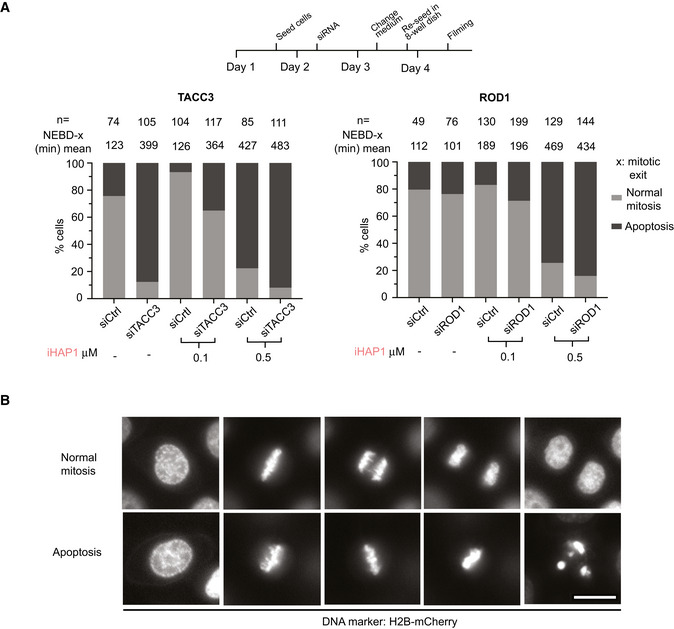
Figure 5. Depletion of TACC3 or Rod1 causes increased cell killing by iHAP1 during mitosis.

- Measurement of time spent in mitosis by time‐lapse imaging taking into consideration whether cells exited mitosis or underwent cell death during mitosis. n indicates the number of cells analyzed from at least two independent experiments. Schematic of experimental protocol on the top. Cells were treated with iHAP1 when indicated at the concentration stated in the figure.
- Representative stills from time‐lapse imaging experiments depicting the two phenotypes. Scale bar represents 20 µm.
Source data are available online for this figure.
