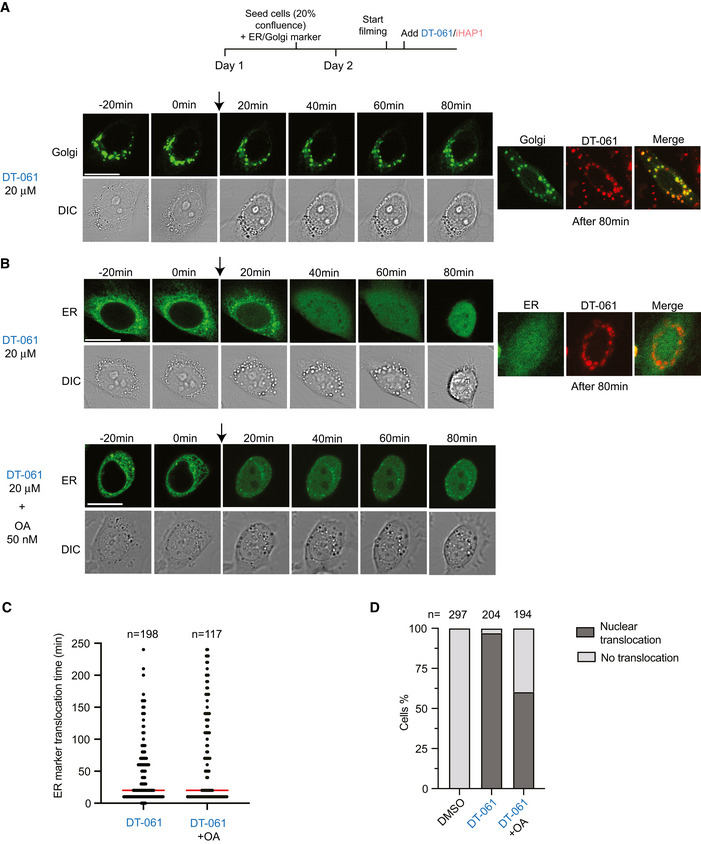
Figure 6. DT‐061 disrupts Golgi and ER structures in HeLa cells.

- Time‐lapse imaging of HeLa cells expressing a marker staining the Golgi apparatus (green) (n = 87 of cells from 2 experiments analyzed all showing dispersal of marker). At time 0, DT‐061 was added. On the right‐hand side, the co‐localization of DT‐061 (red) and the Golgi marker is shown.
- As in (A) but with a marker for ER and either with the addition of DT‐061 alone or DT‐061 + okadaic acid (50 nM)
- Time required for ER signal translocation into the nucleus after drug treatment. Number of cells analyzed per condition shown on top and median indicated by red line.
- Percentage of cells with ER signal translocation into the nucleus after drug treatment. Number of cells analyzed per condition shown on top.
Data information: (A–D) Experiments were repeated at least twice and stills show a representative cell for each treatment condition. Cells were treated with DMSO (Ctrl) or DT‐061 at the concentration stated in the figure. (A and B) Scale bar indicates 20 µm.
Source data are available online for this figure.
