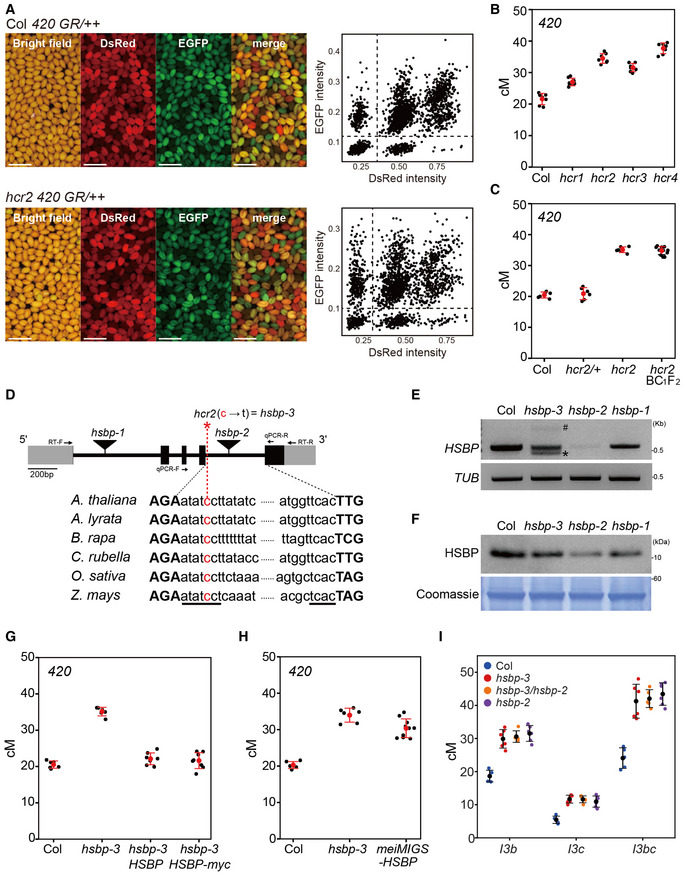
Figure 1. The hcr2 mutant is a weak hsbp allele.

- Representative images of seed fluorescence segregation in 420/++ in wild type (Col) and hcr2. Scatterplots to the right show red (dsRed) and green (eGFP) fluorescence values in 420/++ Col (top) and hcr2 (bottom). Scale bars: 2 mm.
- 420 crossover frequencies (cM) in Col, hcr1, hcr2, hcr3, and hcr4 mutants. n ≥ 7 plants of biological replicates.
- As in (B), 420 crossover frequencies (cM) in Col, hcr2/HCR2, hcr2/hcr2, and individual hcr2 BC1F2 plants. n ≥ 6 plants of biological replicates.
- Schematic diagram of the HSBP locus and position of the hcr2 (hsbp‐3) substitution (red asterisk). Black boxes, exons; gray boxes, UTRs; introns, black lines. The conserved splicing sequence of AT‐AC class introns is underlined. Primer positions for the RT–PCR and RT–qPCR analyses are indicated by arrows.
- End‐point RT–PCR analysis of HSBP in Col, hsbp‐3, hsbp‐2, and hsbp‐1. Hash and asterisk indicate aberrant long and short splicing variants of HSBP in hsbp‐3, respectively. Image J was used to measure relative PCR band intensity for hsbp‐3 (53%), hsbp‐2 (9%), and hsbp‐1 (70%). TUB2 was used as an internal control.
- As in (E), but showing immunoblot analysis of HSBP. hsbp‐3, hsbp‐2 and hsbp‐1 accumulate about 58, 17, and 77% of HSBP levels, respectively. Coomassie‐stained membrane was used as a loading control.
- As in (B), 420 crossover frequencies in Col, hsbp‐3, and hsbp‐3 T1 lines harboring the HSBP or HSBP‐myc transgene. n ≥ 6 plants of biological replicates.
- As in (B), 420 crossover frequencies (cM) in Col, hsbp‐3, and meiMIGS‐HSBP T1 transgenic plants. n ≥ 6 plants of biological replicates.
- As in (B), but showing I3bc crossover frequency (cM) in Col, hsbp‐3, hsbp‐3/hsbp‐2 F1 hybrid, and hspb‐2 plants. n ≥ 5 plants of biological replicates.
Data information: (E, F) Experiments were performed at least three times. (B, G, H) Red dots and horizontal lines indicate mean ± s.d. of cM values from individual plants (one‐sided Welch’s t‐test). Black dots represent cM values of individual plants. (I) Colored dots represent cM values from individual plants.
Source data are available online for this figure.
