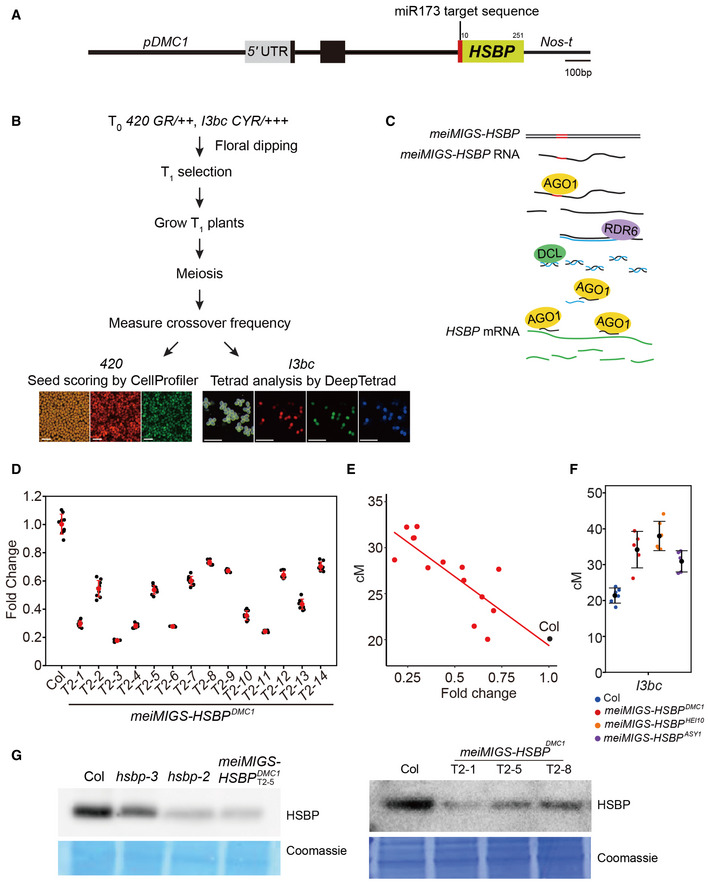
Figure EV2. Meiosis‐specific miRNA‐induced gene silencing (meiMIGS) of HSBP .

- Schematic diagram of the meiMIGS‐HSBP construct. Scale bar, 100 bp.
- Schematic diagram of the pipeline followed to measure crossover frequency in meiMIGS‐HSBP lines using fluorescent 420 seed or pollen I3bc reporters. Scale bars: 1 mm for seeds, 0.25 mm for pollens.
- Schematic diagram of the meiMIGS‐HSBP mode of action to generate trans‐acting miRNAs during meiosis and silence endogenous HSBP transcripts.
- RT–qPCR analysis of HSBP transcript levels in Col and meiMIGS‐HSBP transgenic lines. TUB2 was used as a reference. Data points (black) represent three biological replicates and three technical repeats per replicate. Red dots and horizontal lines indicate mean ± s.d. of values (one‐sided Welch’s t‐test).
- Correlation between 420 genetic distances (y‐axis, in cM) and HSBP transcript levels in floral buds of Col and meiMIGS‐HSBP lines. The x‐axis indicates fold‐enrichment of HSBP transcript levels compared to those in Col, as determined by RT–qPCR. DMC1 was used as a meiotic gene for normalization. Mean values of triplicate RT–qPCR in Col plants and transgenic lines were used. Col and meiMIGS‐HSBP plants are shown as black and red dots, respectively.
- Crossover frequency (cM) of I3bc in wild‐type Col (blue) and meiMIGS‐HSBP T1 transgenic plants using the meiotic promoters from the genes DMC1 (red), HEI10 (orange), and ASY1 (purple) to drive MIGS‐HSBP expression. Data points (color) indicate cM values from individual plants. Black dots and horizontal lines indicate mean ± s.d. of cM values (one‐sided Welch’s t‐test). n ≥ 5 plants of biological replicates.
- Immunoblot analysis of HSBP abundance in Col, hsbp‐3, hsbp‐2, hsbp‐1, and three meiMIGS‐HSBP T2 transgenic lines in buds. Coomassie‐stained membrane served as a loading control. Experiments were performed at least three times.
Source data are available online for this figure.
