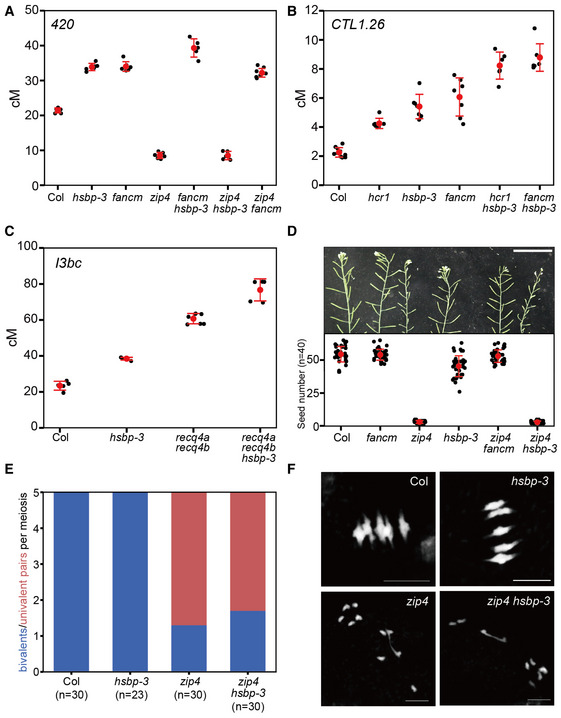
Figure 3. hsbp‐3 leads to an increase in ZMM‐dependent crossovers.

- 420 crossover frequencies (cM) in Col, hsbp‐3, fancm, zip4, fancm hsbp‐3, zip4 hsbp‐3, and zip4 fancm. n ≥ 5 plants of biological replicates.
- As in (A), CTL1.26 crossover frequencies (cM) in Col, hcr1, hsbp‐3, fancm, hcr1 hsbp‐3, and fancm hsbp‐3. n ≥ 6 plants of biological replicates.
- As in (A), I3bc crossover frequencies (cM) in Col, hsbp‐3, recq4a recq4b, and recq4a recq4b hsbp‐3. n ≥ 5 plants of biological replicates.
- Representative silique images and average number of seeds per silique from Col, fancm, zip4, hsbp‐3, zip4 fancm, and zip4 hsbp‐3 plants. Scale bar: 5 cm. Red dots and horizontal lines indicate mean ± s.d. of seed number from siliques. Black dots represent seed number from individual siliques. Significance between genotypes was assessed by Wilcoxon test. n = 40 siliques.
- Average number of bivalents (blue) and pairs of univalent (red) per male meiocyte from Col, hsbp‐3, zip4 and zip4 hsbp‐3. The number of analyzed cells is indicated in parentheses. Significance between genotypes was assessed by Wilcoxon test.
- As in (E), but showing representative metaphase I chromosome spreads stained with DAPI. Scale bar, 10 μm. Images represent three biological replicates.
Data information: (A–C) Red dots and horizontal lines indicate mean ± s.d. of cM values (one‐sided Welch’s t‐test). Black dots represent cM values of individual plants.
