
Figure EV3. HSBP represses HEI10 transcription by inhibiting HSFs.
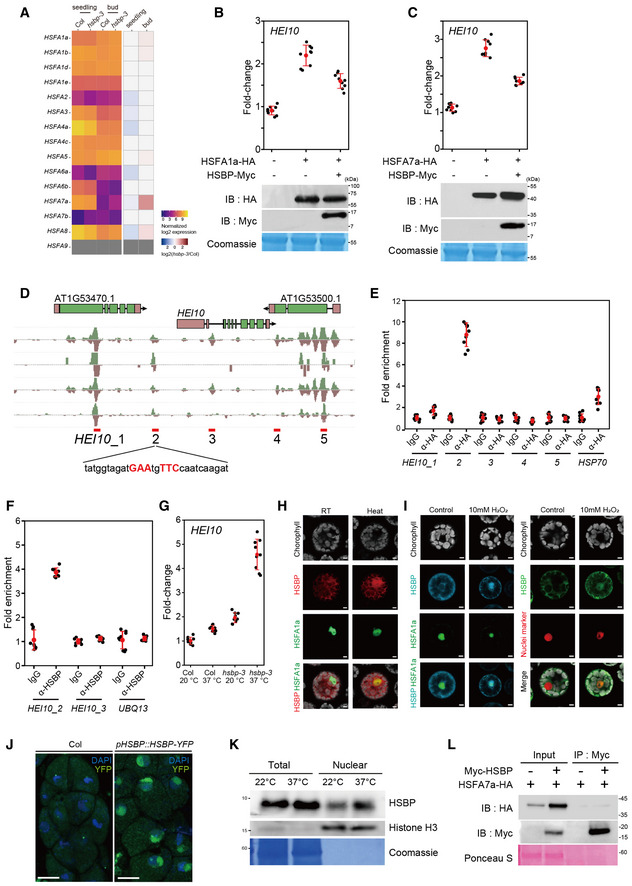
- Heatmap representation of transcript levels in Col‐0 and hsbp‐3 for Arabidopsis class A HSF genes in seedlings and buds from RNA‐seq data.
- RT–qPCR analysis of relative HEI10 transcript levels following transient transfection of HSFA1a and HSBP effector constructs in Arabidopsis protoplasts and after heat treatment (40°C for 1 h). Immunoblots of HSF1a‐HA and HSBP‐Myc in transfected protoplasts. Coomassie‐stained membrane served as a loading control.
- As in B, for HSFA7a and HSBP.
- DAP‐seq data of HSFs at HEI10 regulatory regions. Candidate HSEs (HEI10_1 to 5) around HEI10 are shown.
- As in (B), but showing ChIP–qPCR analysis of HSF7a at HEI10 regulatory regions in protoplasts expressing HSF7a‐HA. IgG was used as a negative control.
- As in (B), but showing HSBP ChIP–qPCR analysis in heat‐treated seedlings using anti‐HSBP antibody. Seedlings (10‐day) were incubated at 37°C for 3 h and used for ChIP analysis.
- RT–qPCR analysis of relative HEI10 transcript levels in Col and hsbp‐3 after heat treatment. Seedlings (10‐day‐old) were incubated at 37°C for 4 h. Data points (color) indicate values of replicates. Black dots and horizontal lines mean ± s.d. values (one‐sided Welch’s t‐test). n ≥ 6 two or three technical duplicates of three biological replicates.
- Co‐localization of the fluorescent fusion proteins HSBP‐RFP and HSFA1a‐GFP in protoplasts. Heat indicates incubation of transfected protoplasts at 40°C for 1 h. Scale bars: 5 μm.
- As in (H), but showing HSBP‐CFP and HSFA1a‐GFP (left), and HSBP‐GFP and nucleus marker (ARR2‐mRFP) (right) after H2O2 treatment. Scale bars: 5 μm.
- Nuclear location of HSBP in male meiocytes of HSBPpro:HSBP‐YFP plants. Nuclei spreads were stained with DAPI. Scale bars: 10 μm.
- Immunoblot analysis of HSBP and histone H3 levels using total proteins and nuclear extracts of Col seedlings. Seedlings (10 days old) were incubated at 37°C for 3 h. The Coomassie‐stained membrane was used as a loading control. Experiments were performed at least three times.
- Co‐immunoprecipitation analysis of Myc‐HSBP with HSF7a‐HA. IB, immunoblot; IP, immunoprecipitation. Ponceau S staining of the membrane, a loading control. Experiments were performed at least three times.
Data information: (B, C, E, F) Experiments were performed three times. Data points (black) indicate three technical duplicates of three biological replicates. Red dots and horizontal lines indicate mean ± s.d. values (one‐sided Welch’s t‐test).
Source data are available online for this figure.